A cause-effect diagram is a visual tool that we can use to logically organize possible causes for a specific problem or effect by graphically displaying them in increasing detail, suggesting causal relationships among theories. There are a number of popular types of these tools. In this help article, we are going to provide step-by-step instructions on how to use the Cause and Effect Chain tree diagram offered by the PRIZ Innovation Platform.
Using Cause & Effect Chain
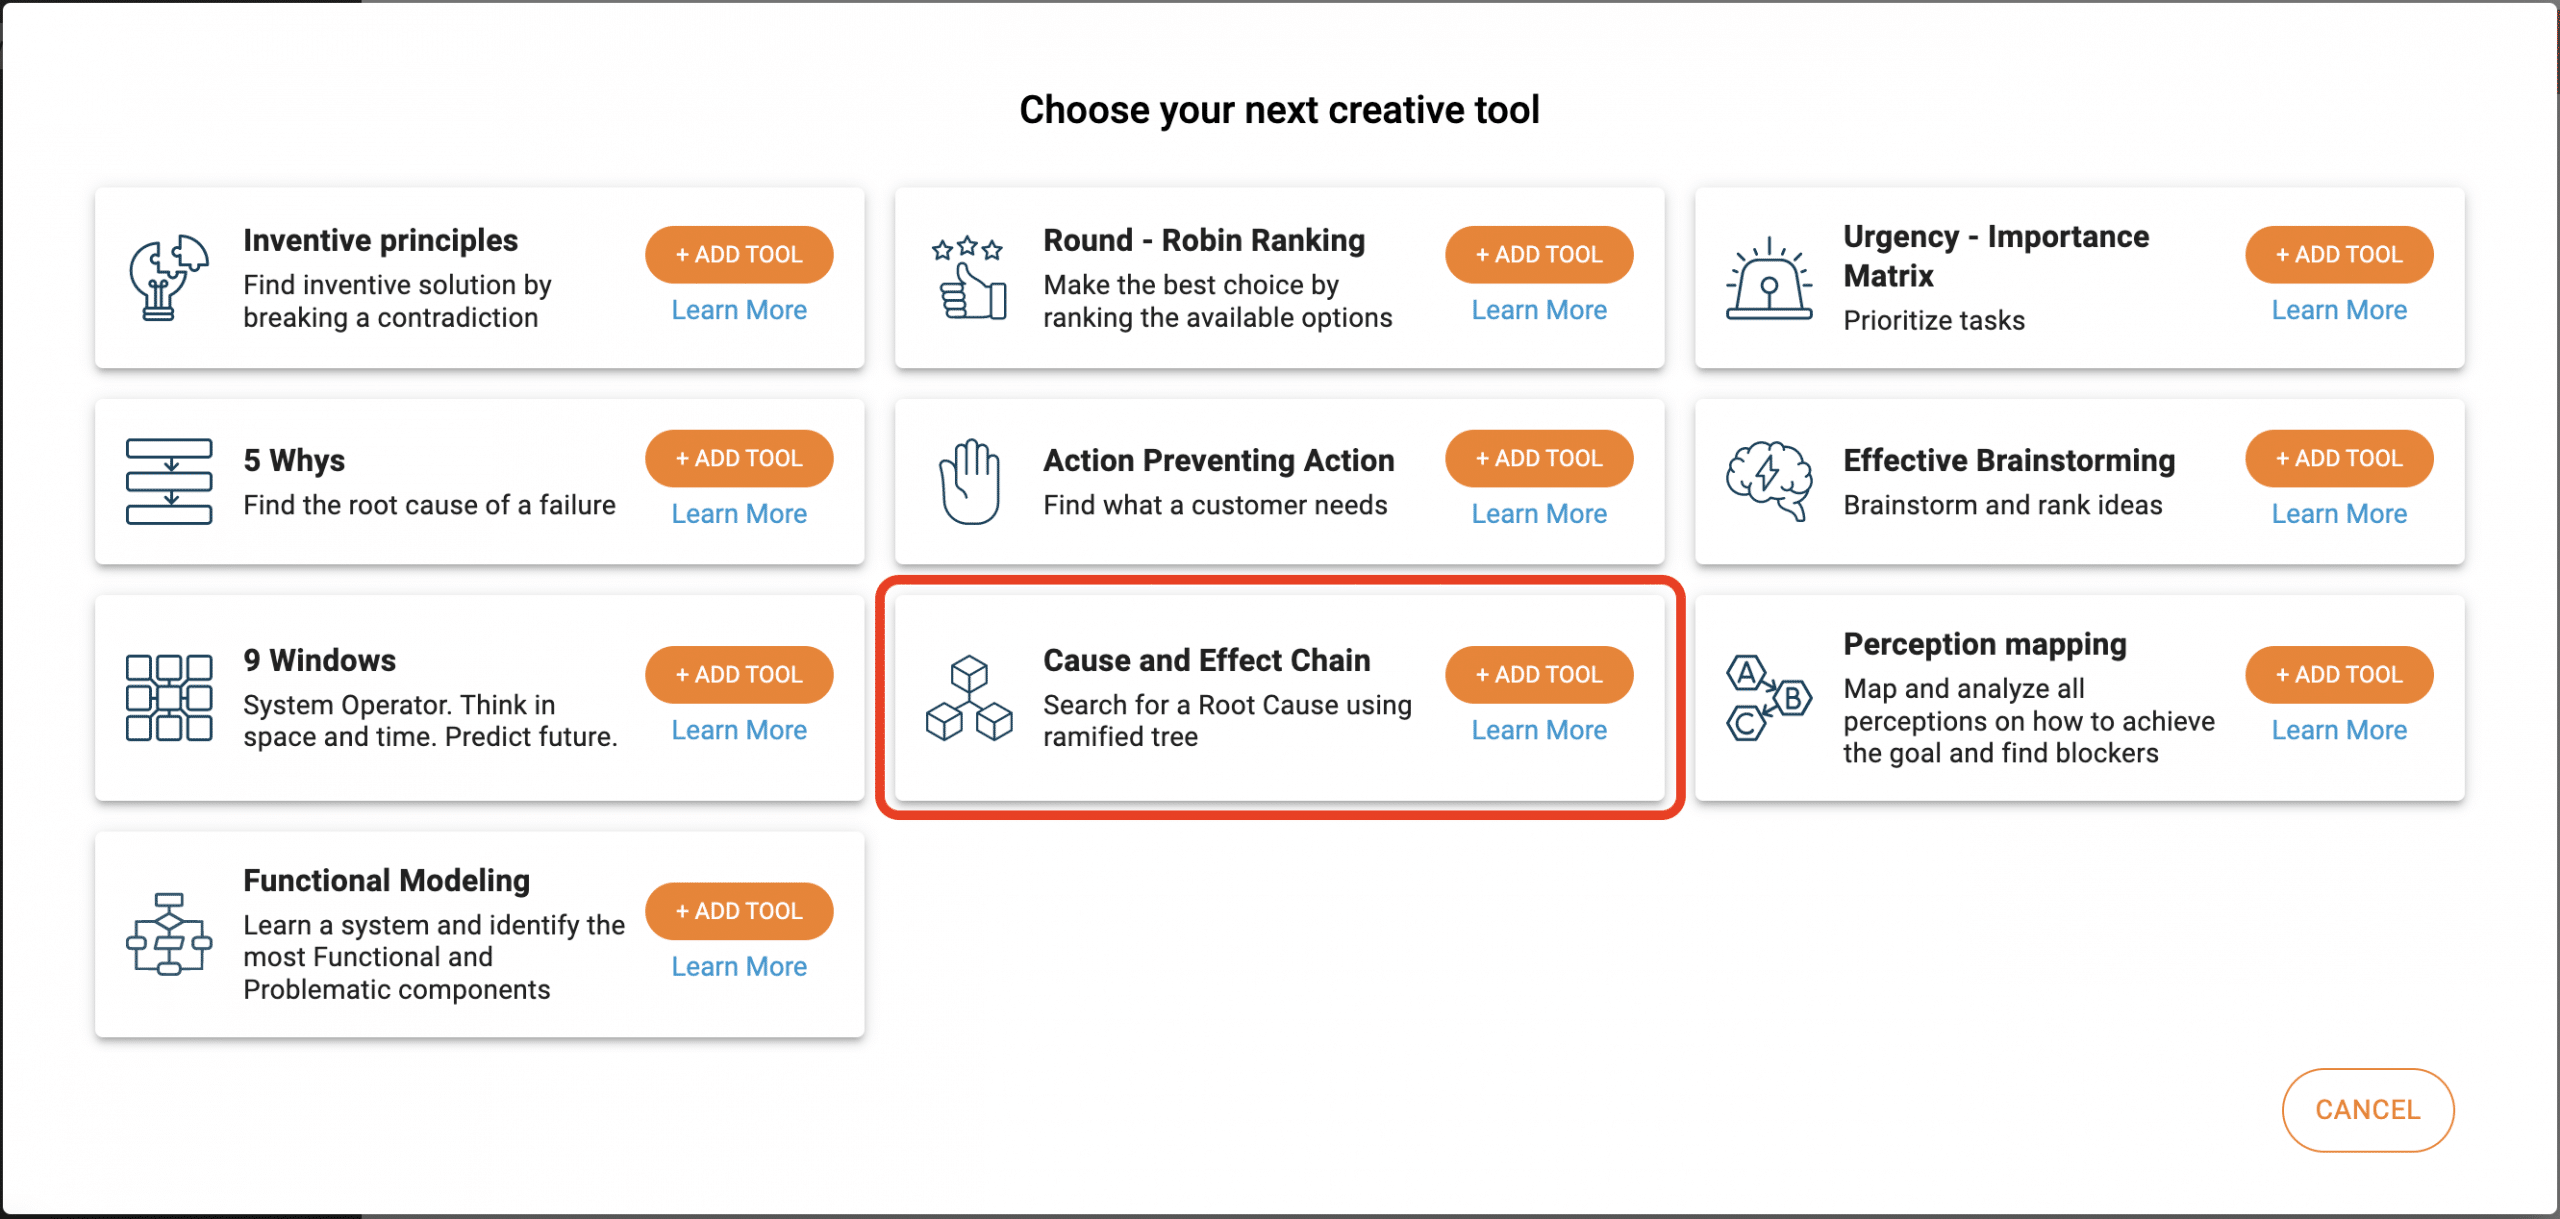
Here, we assume that you already know how to start using a new tool. For more information about that visit Creative Tools article. Cause and Effect Chain (CEC) free diagram is one of the available tools in the PRIZ Innovation Platform.
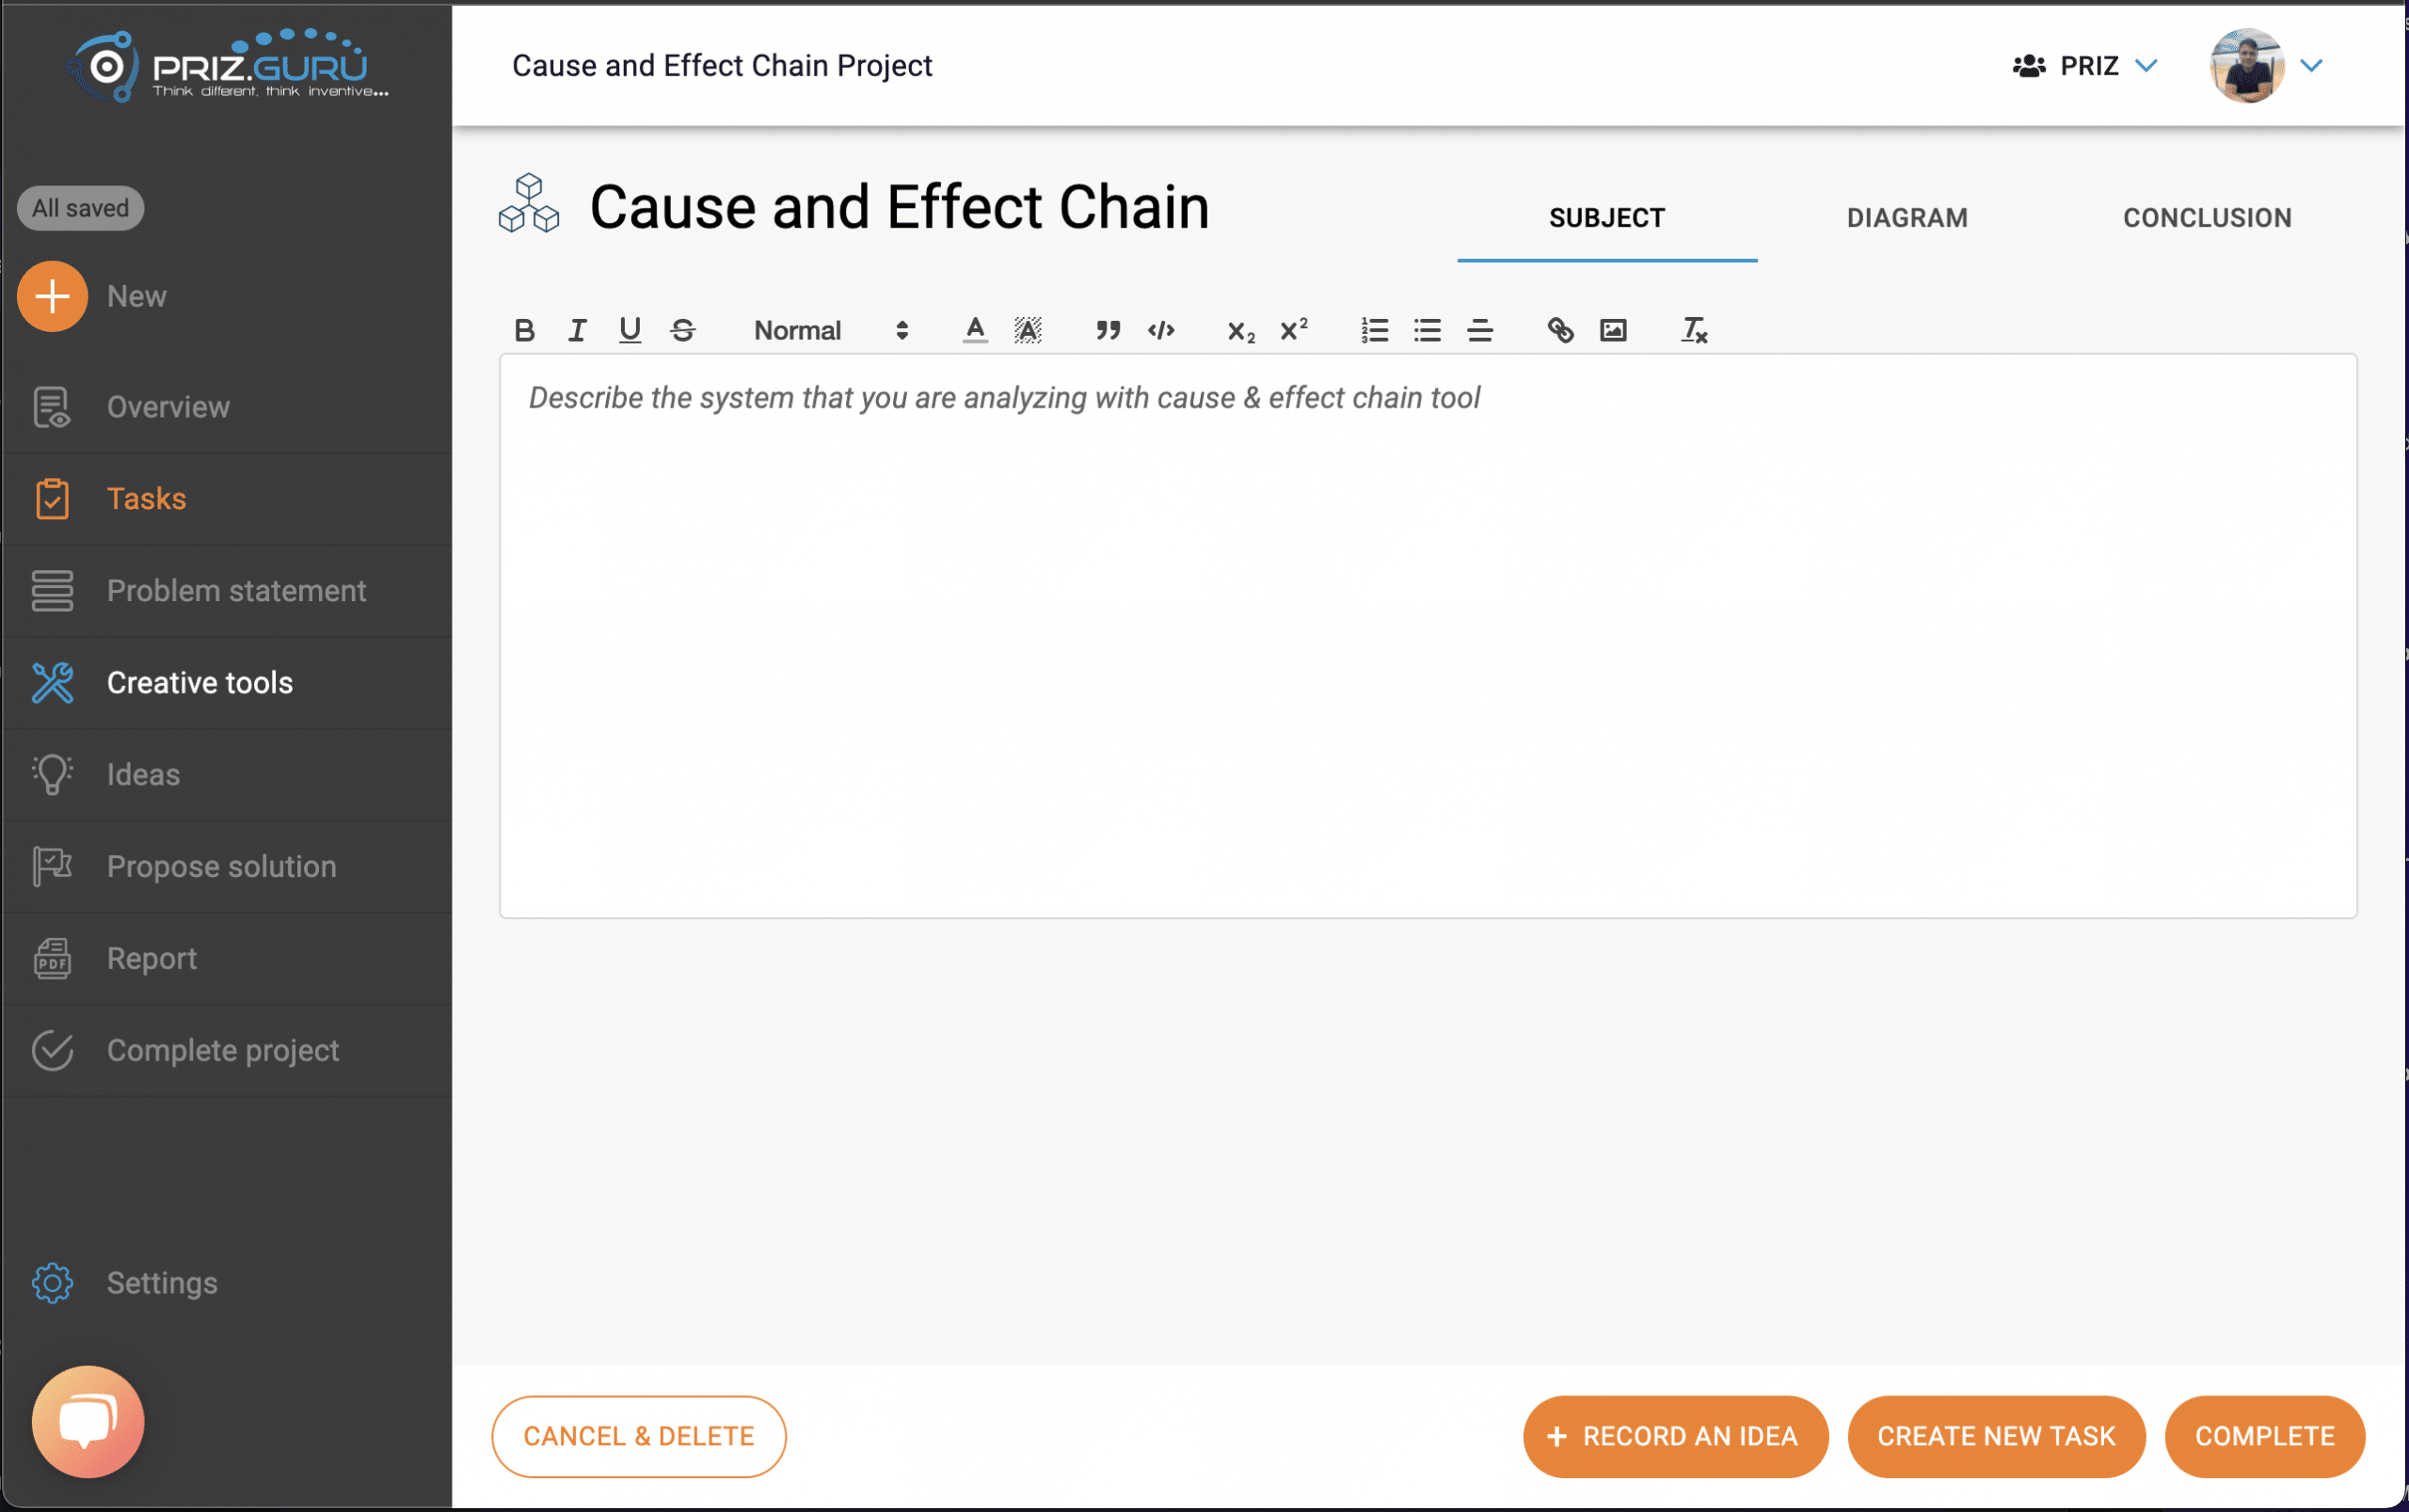
Once the tool is created, the system will redirect you to the tool itself.
Similar to many other tools, CEC also has a number of sections for you to use:
- Subject – a free form description of a subject (system, problem, situation, etc…) that you are planning to analyze
- Diagram – this is where you will build the CEC tree diagram itself
- Conclusion – free form description of any conclusions that came out of your analysis
Subject
The subject is a generic name for anything that you are analyzing with the help of any tool. It could be a piece of equipment, a description of a system or a process, a failure that you are analyzing. The subject is any information that may help you and your team to come up with the most comprehensive causal chain. It is a free format rich text editor and can include anything including images, links, and any formatting the editor allows.
Keep in mind, any thinking process can be very dynamic and often change direction. This is normal, and when you analyze your subject you might remind yourself of something that you didn’t think about at the very beginning – a piece of a system, step in a process, and other details.
The thinking process is unpredictable, hence we made this information available and as close as possible to the tool you currently use.
Diagram
As we mentioned above, the diagram tab is where you are going to build the cause and effect chain tree diagram itself.
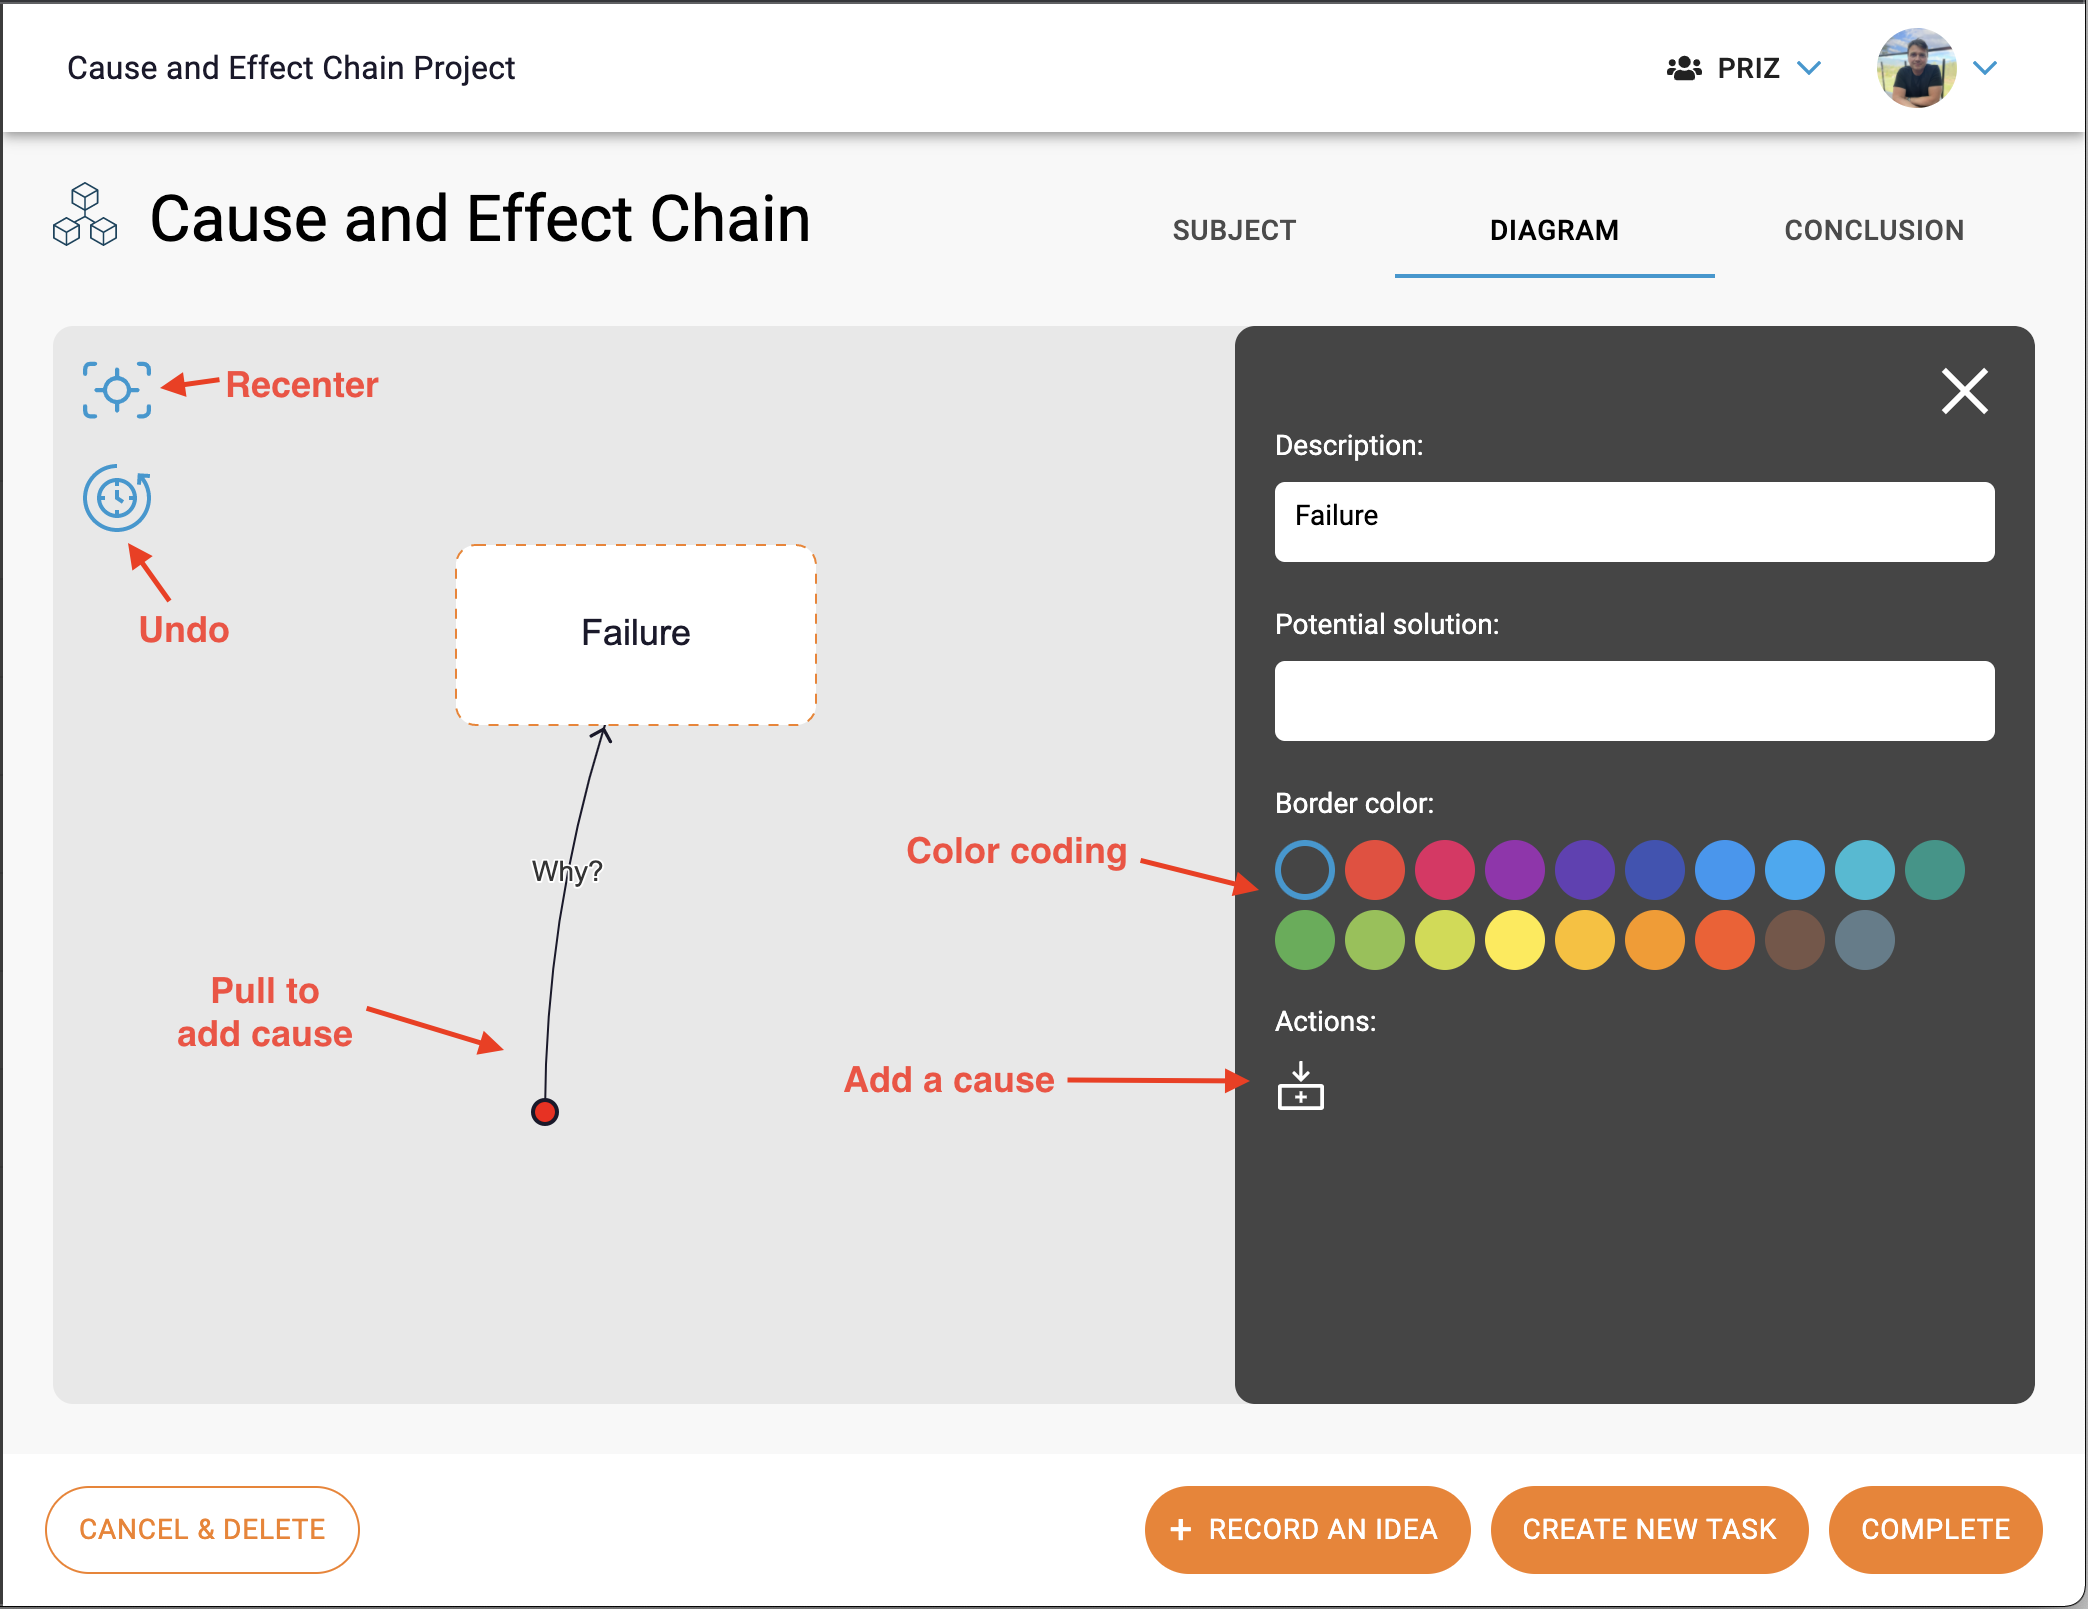
The first time you navigate to the diagram tab, you’ll have a single empty node (without even a description) as a placeholder. This is the root node of the diagram. Cause and effect diagram can only have a single root node. The root node represents the failure which you are planning to find a root cause for.
There are three areas in the diagram tab which allow you to fully control the process of building the tree.
Canvas
Canvas is the main work area, where an innovator builds a tree diagram. A root node (failure) is always at the very top of the diagram. New nodes (causes) can be added by dragging from any node; once you release the mouse button, a new cause will be created. All the causes will be automatically organized in a form of a tree.
Every cause node has additional settings. The settings dialog will become visible (on the right-hand side) when a node is selected.
If it’s not shown, it is most likely collapsed and you need to open it by clicking on a hamburger button (![]() ) in the top right corner of the canvas.
) in the top right corner of the canvas.
Node (Cause) Settings Dialog
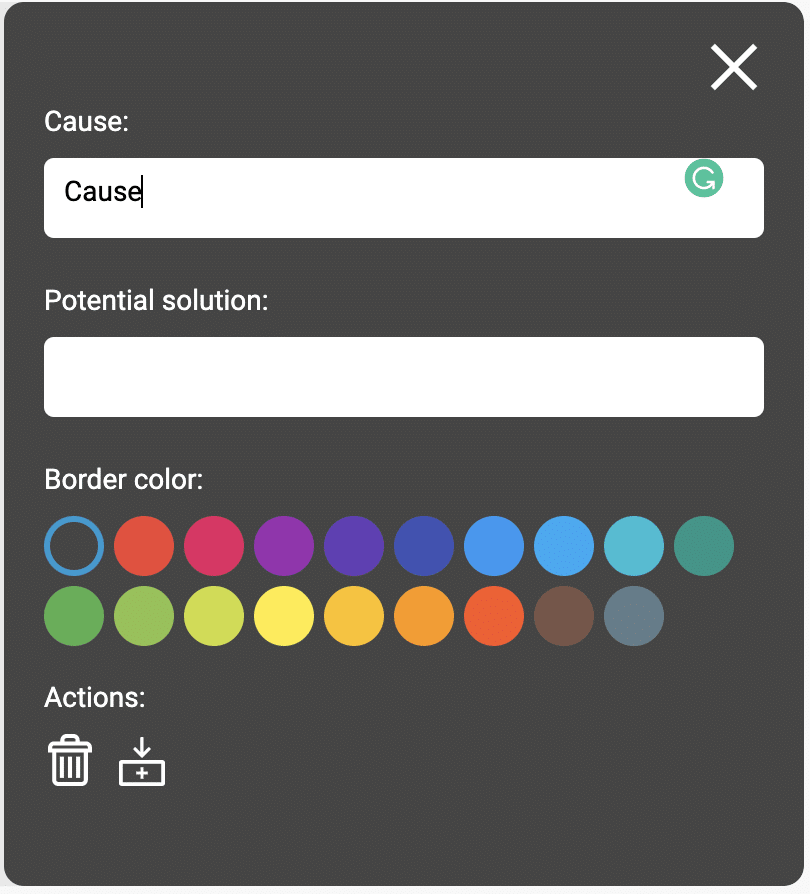
Every node in CEC has the following settings (top to bottom):
- Title/description
- Potential solution – this field is not only for a potential solution, but any notes you, and your team, want to have on the node. In most cases, people think of a solution in the process; hence the name.
- Border color – is allowing the user to color code any node for their own convenience
- Actions:
Delete – allows deleting a node (only available for causes)
Add cause – another option to add a cause for a selected node
Sample of CEC tree diagram
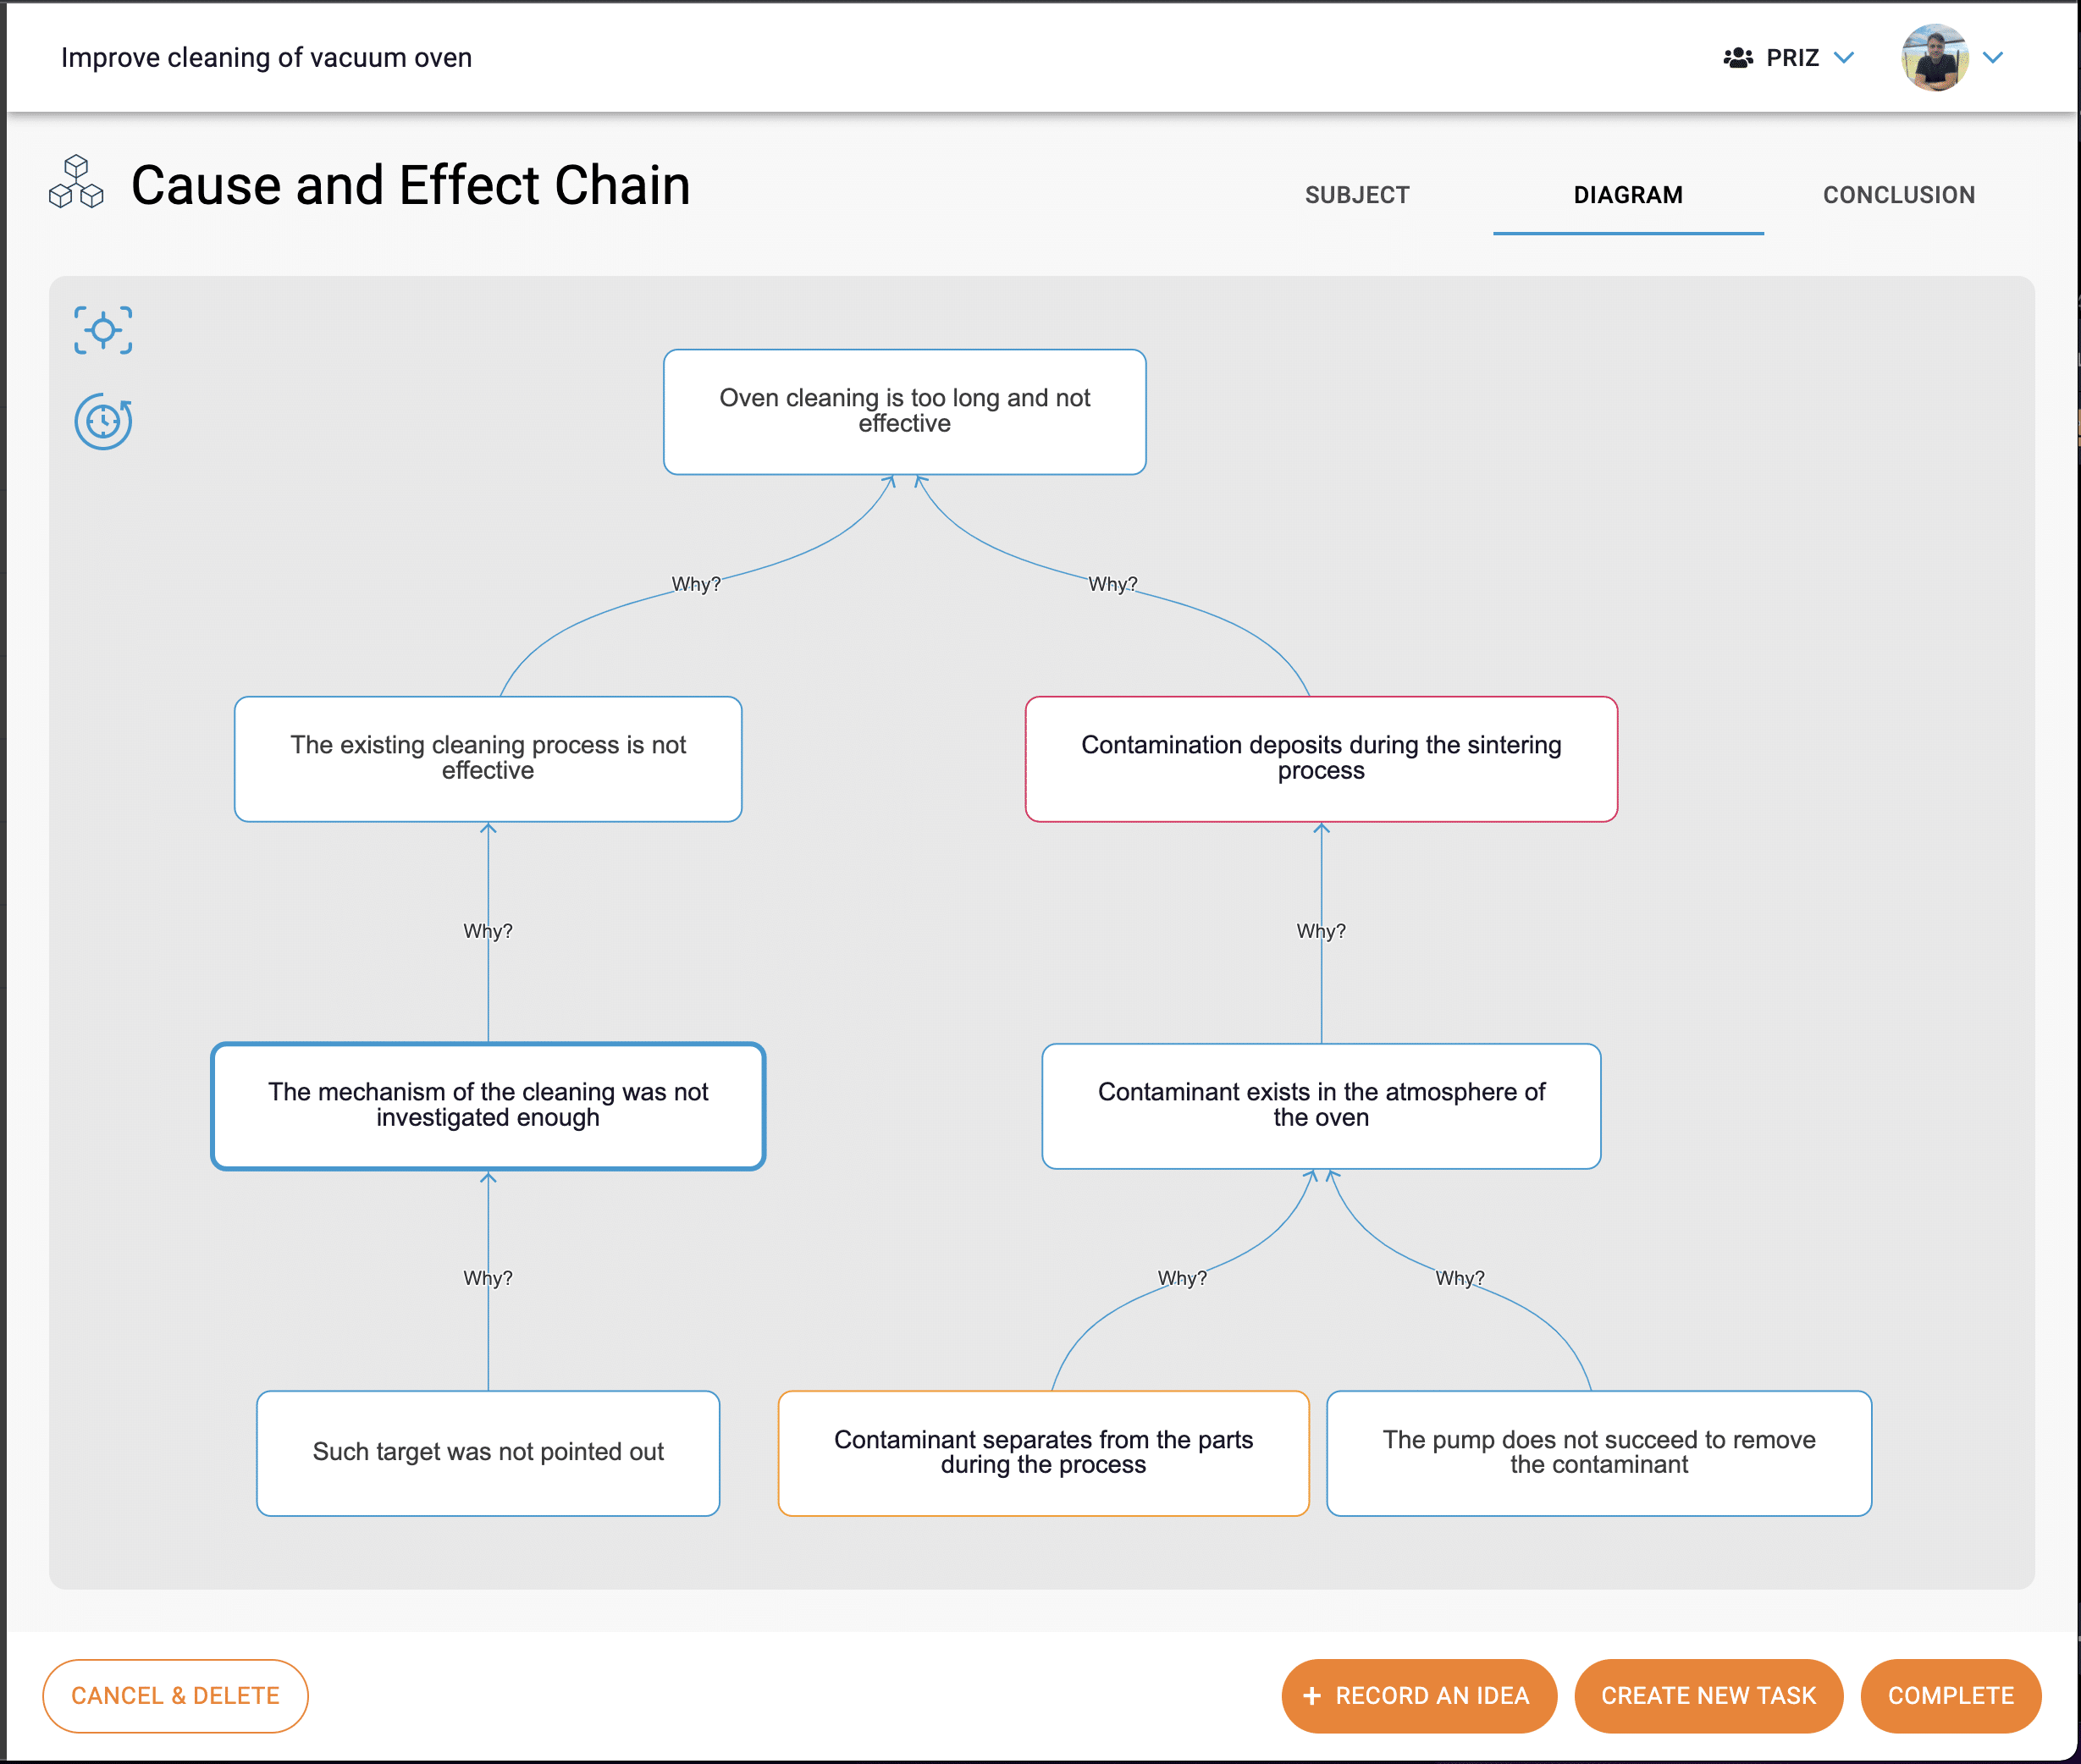
The whole target of building CEC diagrams is to help you and your team think about possible causes for a failure that you are working on. In this process, you will quickly realize that some scenarios would not be even considered otherwise. Also, when working on CEC analysis in a group, team members will start complementing each other ideas, sharing knowledge, and uncovering many more possible causes which you would never imagine.
Conclusion
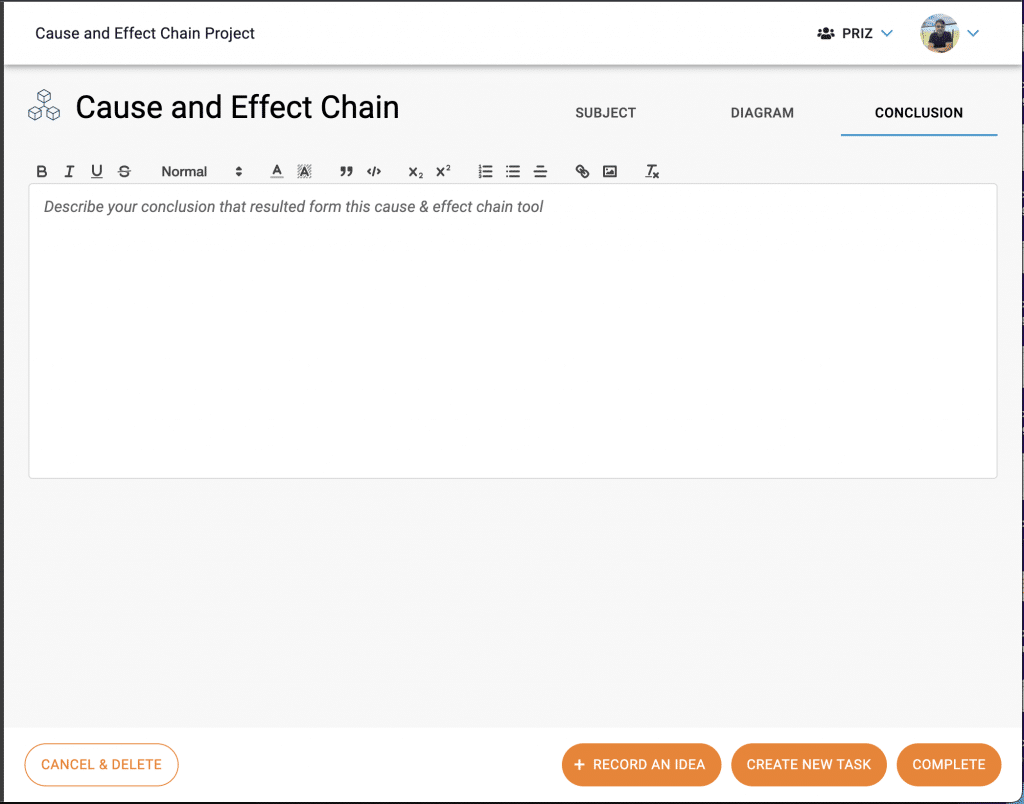
The conclusion tab is the place where you can document any conclusions that you have as a result of the current cause and effect chain analysis. This is a free format rich text editor. Similar to the subject tab, you are welcome to have any information you feel is useful for you, your team, and your leadership. The conclusion will also be included in the final report with anything else related to your work with this tool.
Tool controls & final notes
Like any other tool, the cause and effect chain tool also has controls at the bottom of the page.

These controls are always visible while you are working on any tool.
Cancel & Delete button allows you to delete one particular use (instance) of a tool, in case you decided that you don’t need it.
Record an Idea button allows you to record an idea at a project level at any point in time. These ideas are collected in ideas manager.
Create New Task button allows you to create a new task without leaving a tool. Just imagine that, while working on a tool, you and your team decided that there is something that you need to do. This is how you would record that task.
Complete button allows you to complete the usage of a tool and lock all the related data. The data will stay available for viewing, but not for editing.
Contact us with any questions.