How Change Flow Thinking (CFT) helps QA leaders embed quality at step zero and keeps surprise costs off the CFO’s desk.
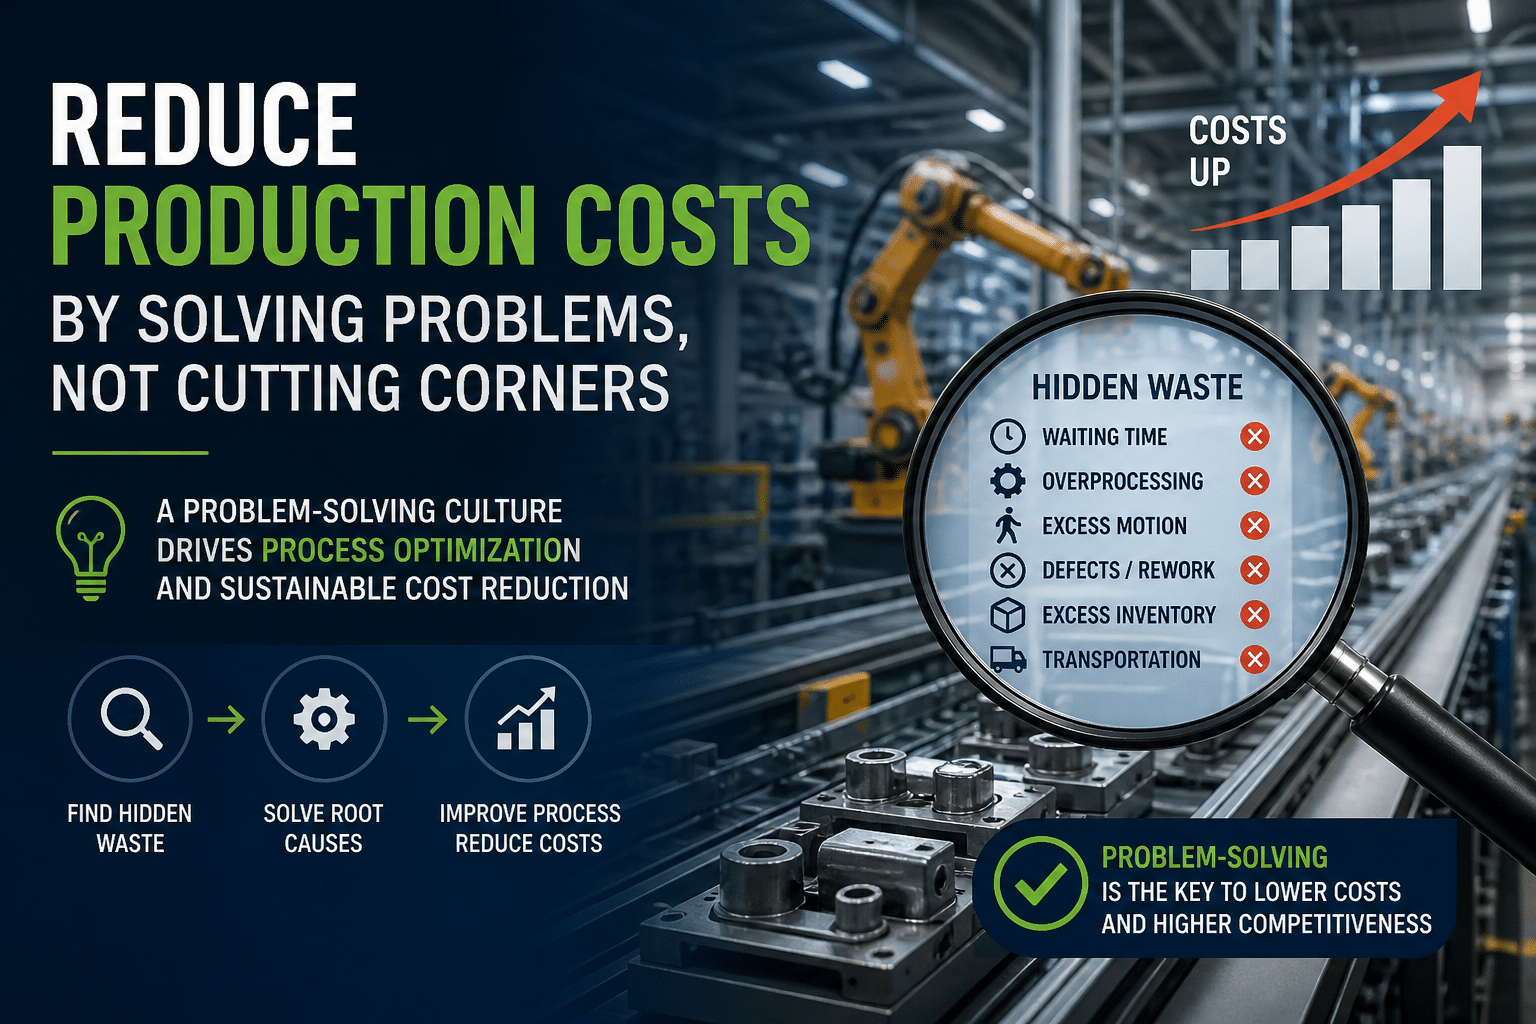
Manufacturers that still rely on inspect-and-fix discover defects only after the schedule and spend are fully committed. Every late finding triggers re-work, premium freight, or engineering change orders. With Cost of Poor Quality (COPQ) often running 15–20 % of annual sales, the root problem is clear: risk management was never built into the original change.
Quality by Design (QbD) reverses the old sequence: instead of chasing defects, teams engineer risk out before the first prototype. That discipline needs a shared workflow—one that surfaces hazards early, compares options, and lets Finance see the exposure in real time. Change Flow Thinking provides exactly that: a living map of every task, each labelled Satisfactory, Problematic, or Blocking so quality, engineering, and Finance can co-own the decision long before production starts.
| CFT mechanic | What it does | Bottom-line impact |
|---|---|---|
| Status colours (green/amber/red) | Flags risk as it appears and forces discussion while options are cheap. | Fewer late engineering changes; tighter launches. |
| Branching for alternatives | Teams model and cost parallel routes whenever a step is Blocking. | Finds a lower-risk path instead of letting hidden hazards through. |
| Unified visual canvas | QA, Engineering, Ops, and Finance work on the same source of truth. | Eliminates misalignments that spawn duplicate spending. |
| One-click audit trail | Every decision is stored with the step that triggered it. | Cuts prep time for regulatory and financial audits. |
CFT is the backbone; PRIZ tools are the muscles that make each node smarter. When you hit a red or amber step, launch the right tool in context, save the output, and watch the node flip to green. All tools below are native to the platform.
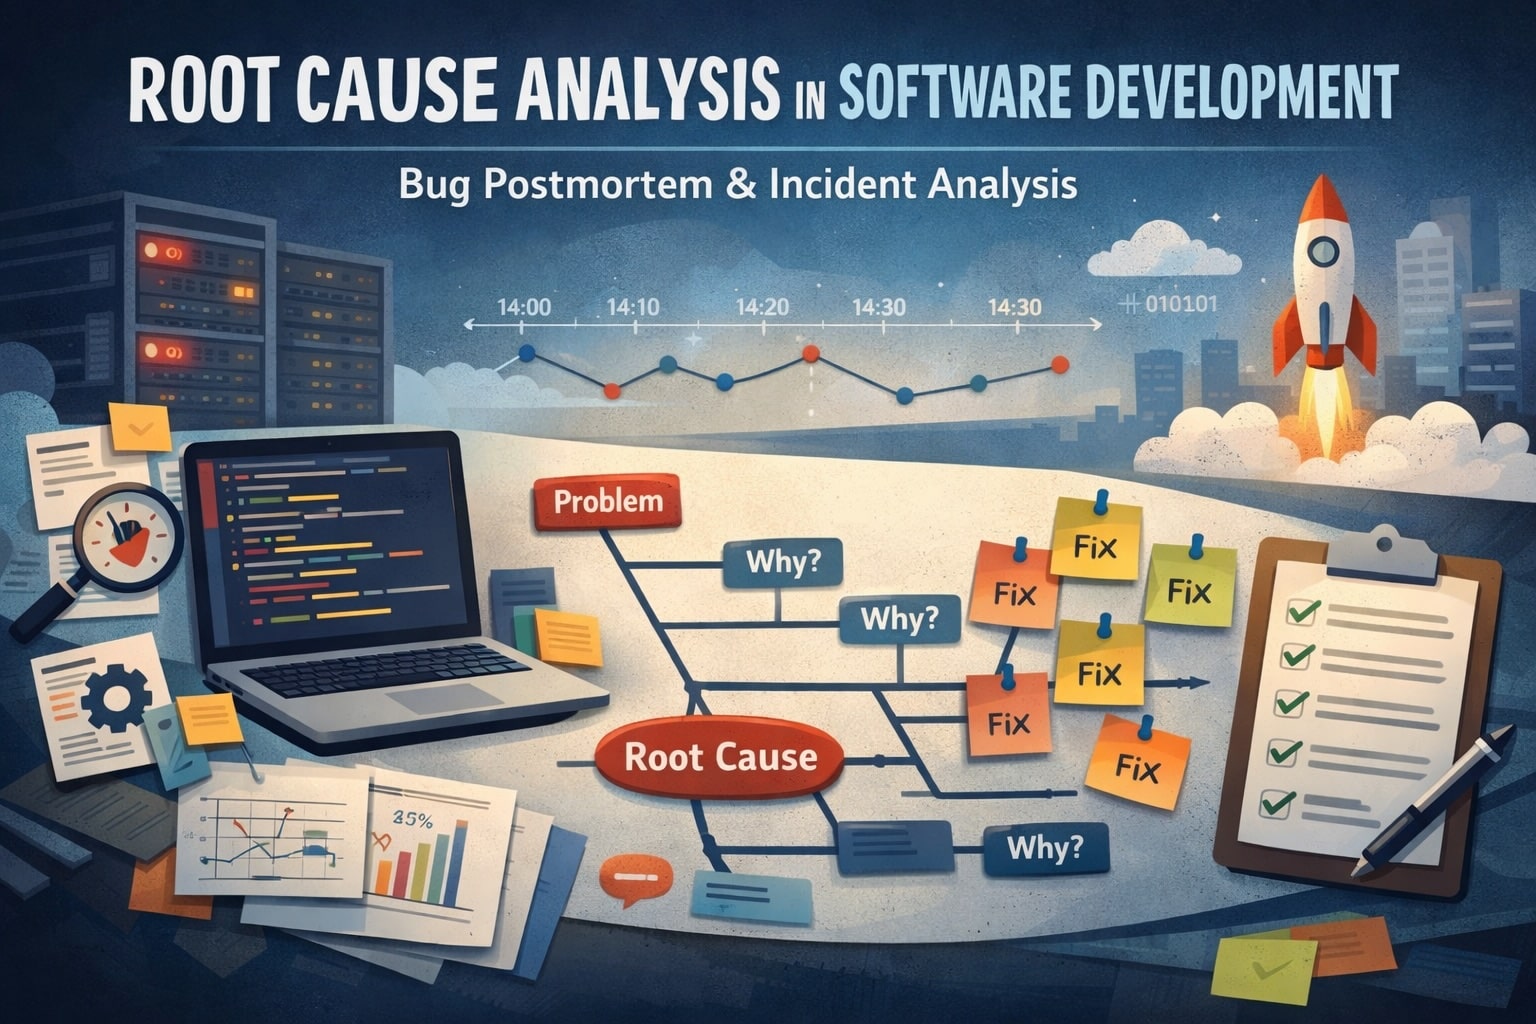
Cause & Effect Chain sketches the causal pathways that turn a nuisance into a critical risk, while 5 + Whys drives the questioning five layers deep. Together, they convert a vaguely “Problematic” step into a precise statement of why quality would fail and what to fix.
Example: A filler nozzle keeps jamming on a new packaging line. The chain shows lubricant contamination; 5 + Whys traces that to an incompatible grease chosen for cost. Swap the spec now, not after 10,000 defective units.
Process Functional Modeling (PFM) breaks a workflow into value-adding operations; System Functional Modeling (SFM) does the same across components and software modules. By revealing how energy, materials, or signals flow, they spot side-effects—overheating, vibration, data lag—that classic FMEA often misses.
Example: Switching a pump impeller material looks harmless until SFM shows the new alloy changes resonance and overstresses a downstream seal. Risk neutralised before the purchase order.
Once the hazard is clear, teams jump to 40 Inventive Principles or the Effective Brainstorming board to create fresh design ideas that break the trade-off instead of accepting it. Because the session sits inside the same CFT branch, the best concept can be cost-scored and voted into the flow instantly.
Time and budget are finite. Urgency–Importance Matrix visualises which risks threaten either launch date or regulatory compliance; Round-Robin Ranking turns a roomful of SMEs into a data-driven verdict on which mitigation to fund first.
9 Windows Thinking stretches the conversation in time and space (“What happens to this risk five years out?”). Perception Mapping highlights mental blind spots—helpful when a Problematic step is rooted in operator behaviour rather than hardware.
For residual red flags, Action Preventing Action (APA) asks a single brutal question: Can this failure mode reach the customer at all? If the answer is yes, the node stays Blocking until a failsafe is designed, or the whole branch is abandoned.
Every insight flows back into the CFT diagram, giving QA, Engineering, and the CFO an instant read on whether the change is now risk-managed and quality-ready.
Early adopters report 30–50 % cuts in corrective-action spend and launches accelerated by weeks.
| Metric | Typical result after CFT-driven QbD |
|---|---|
| Scrap & re-work cost | ↓ 20–40 % |
| Engineering change orders post-release | ↓ 50 % |
| Capital expenditure avoided | Six- to seven-figure savings |
| Audit findings | Near-zero non-conformances |
Beyond the numbers, Finance gains steadier cash flow and fewer mid-quarter emergencies, while QA secures a repeatable playbook for proactive quality.
When risk management is woven into every change at the design stage, quality turns from cost centre to profit lever. Change Flow Thinking and the PRIZ toolbox give teams the microscope and the map for true Quality by Design—delivering safer launches, lower COPQ, and results the CFO will notice.