TL;DR – 90-Second Summary
Hidden process drifts often stay invisible until final inspection—or worse, a customer complaint—triggering frantic line stoppages, re-work, and premium freight. Predictive QA surfaces those drifts hours or days sooner and guides teams—via PRIZ Guru’s structured tools—straight to preventative action. The result: double-digit Cost-of-Poor-Quality (COPQ) savings and far fewer 2 a.m. firefights.
For most Quality Assurance teams, defects are discovered after they are baked into the product. Scrap, premium freight, and warranty claims routinely consume 15–20 % of annual sales—a range the American Society for Quality cites as typical COPQ in manufacturing. These losses recur because plants still rely on lagging indicators that scream only when the damage is done.
Every unplanned stoppage triggers a cascade of expense:
Sample impact: A $200 M plant × 0.18 COPQ ≈ $36 M/year burned on reactive quality alone.
Traditional dashboards turn red only after specification limits are breached; they ignore faint precursors such as:
Engineers launch midnight data dives, operators swap parts “just in case,” and CAPA queues balloon. Terabytes of historical data remain noise, not insight.
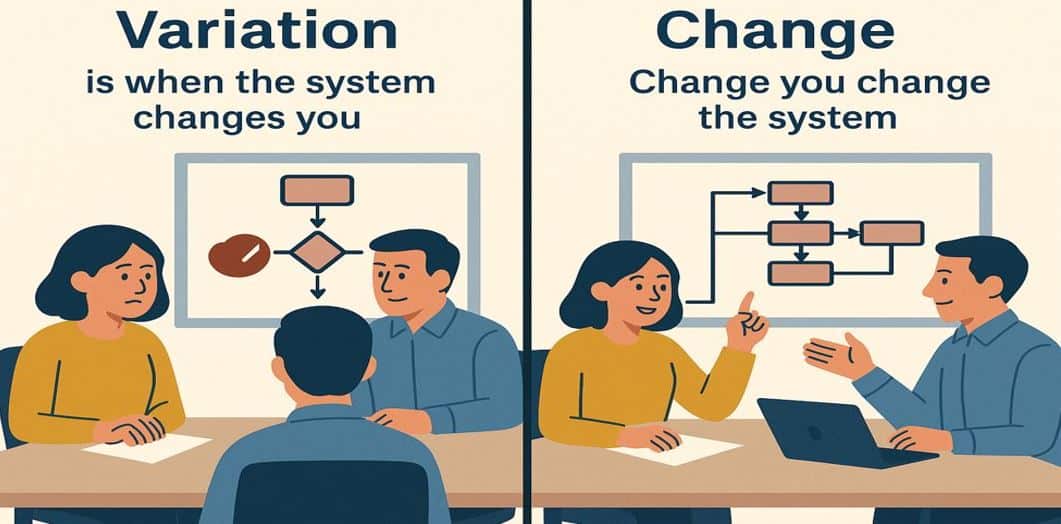
| Reactive QA | Predictive QA | |
|---|---|---|
| Detection | Symptoms | Precursors |
| Timing | After non-conformance | Before non-conformance |
| Response | Issue CAPA | Execute preventative action |
| Knowledge | Tribal memory | Trained models + systematic tools |
| Resource Use | Fire-fight & scramble | Plan maintenance/material proactively |
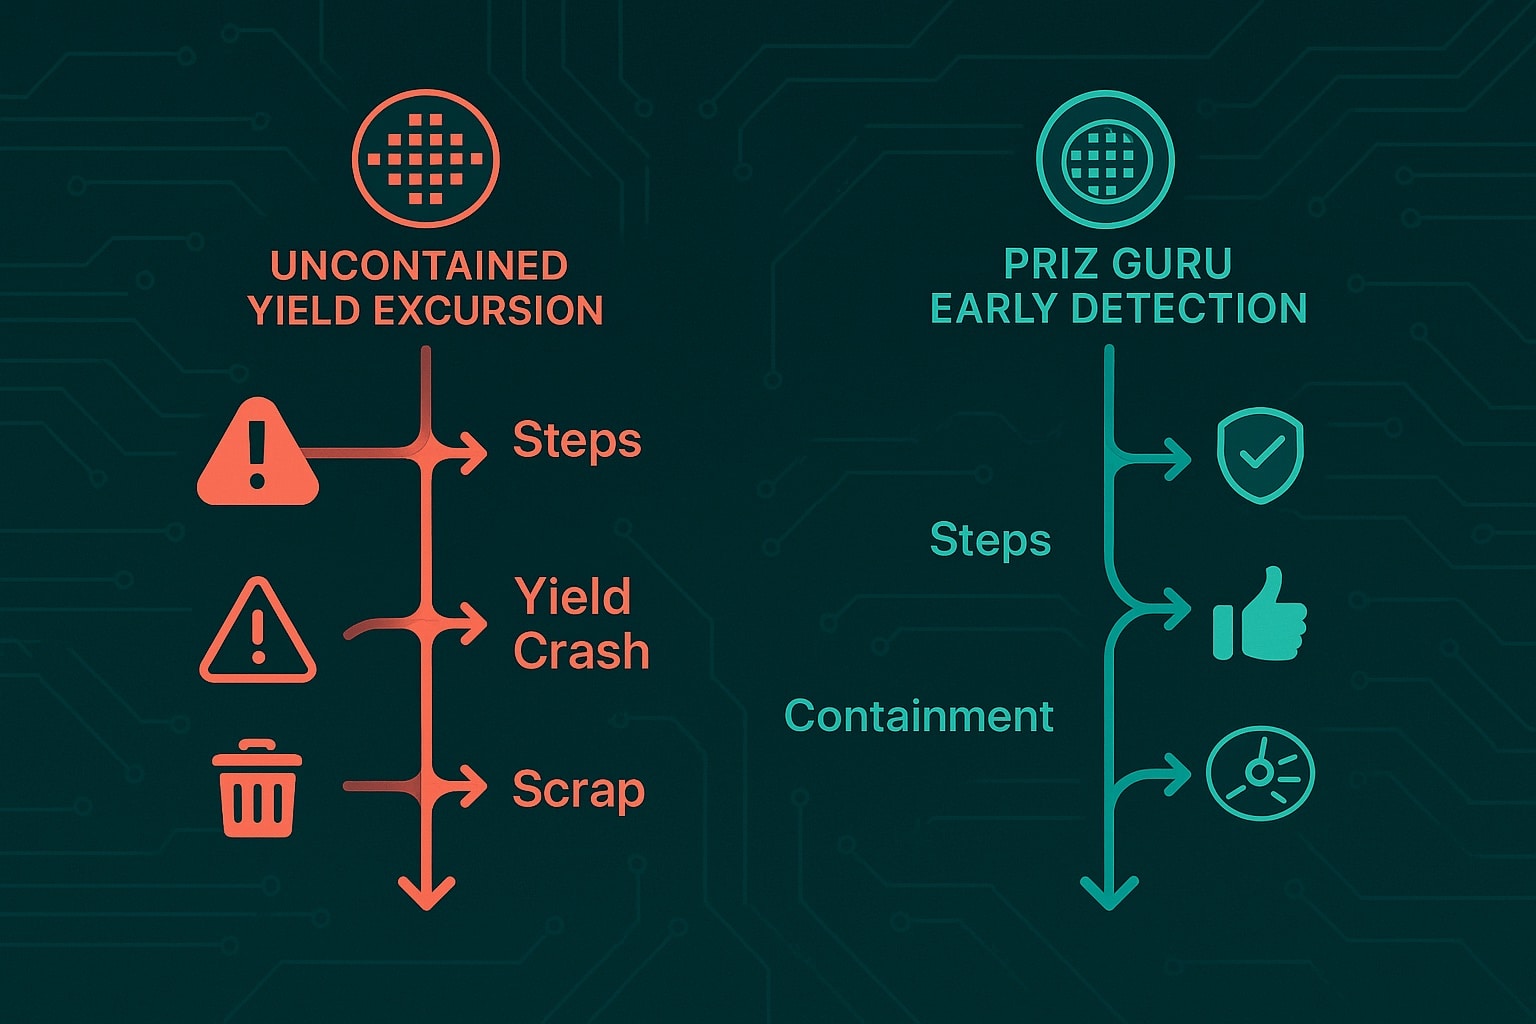
Predictive QA flips the script by converting raw signals into leading indicators that buy intervention time.
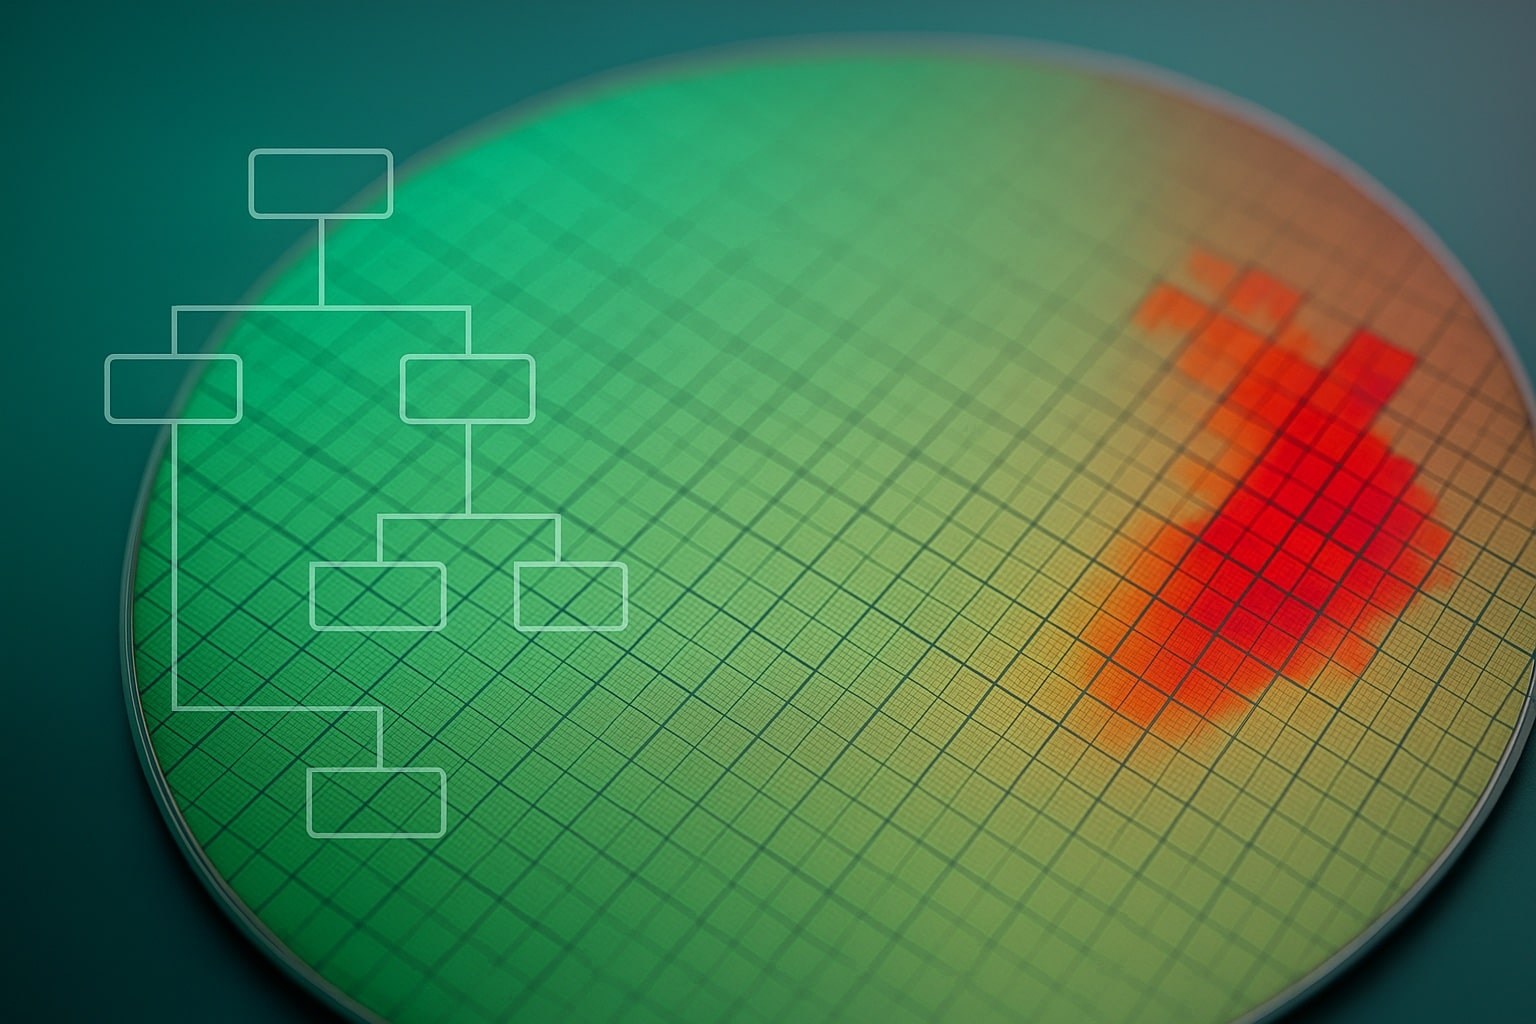
Historian, MES, and lab data converge in one stream—no more CSV exports.
Statistical-process-control limits pair with AI drift-detection to flag subtle shifts hours before CpK crashes.
When a soft alert fires, engineers jump directly into structured root-cause analysis and preventative action—no all-hands panic required.
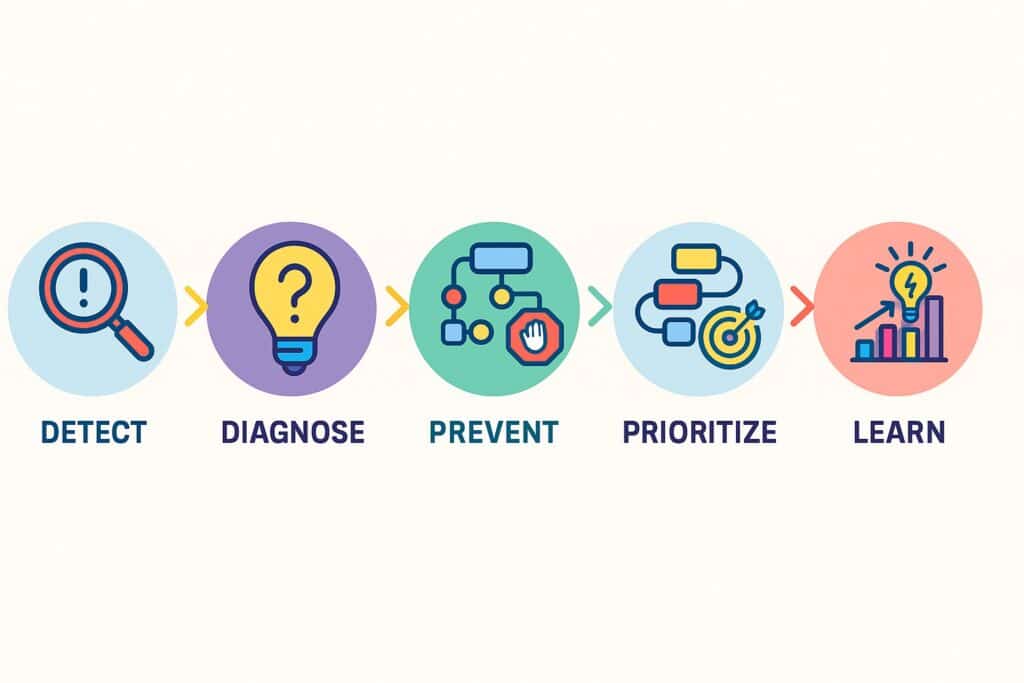
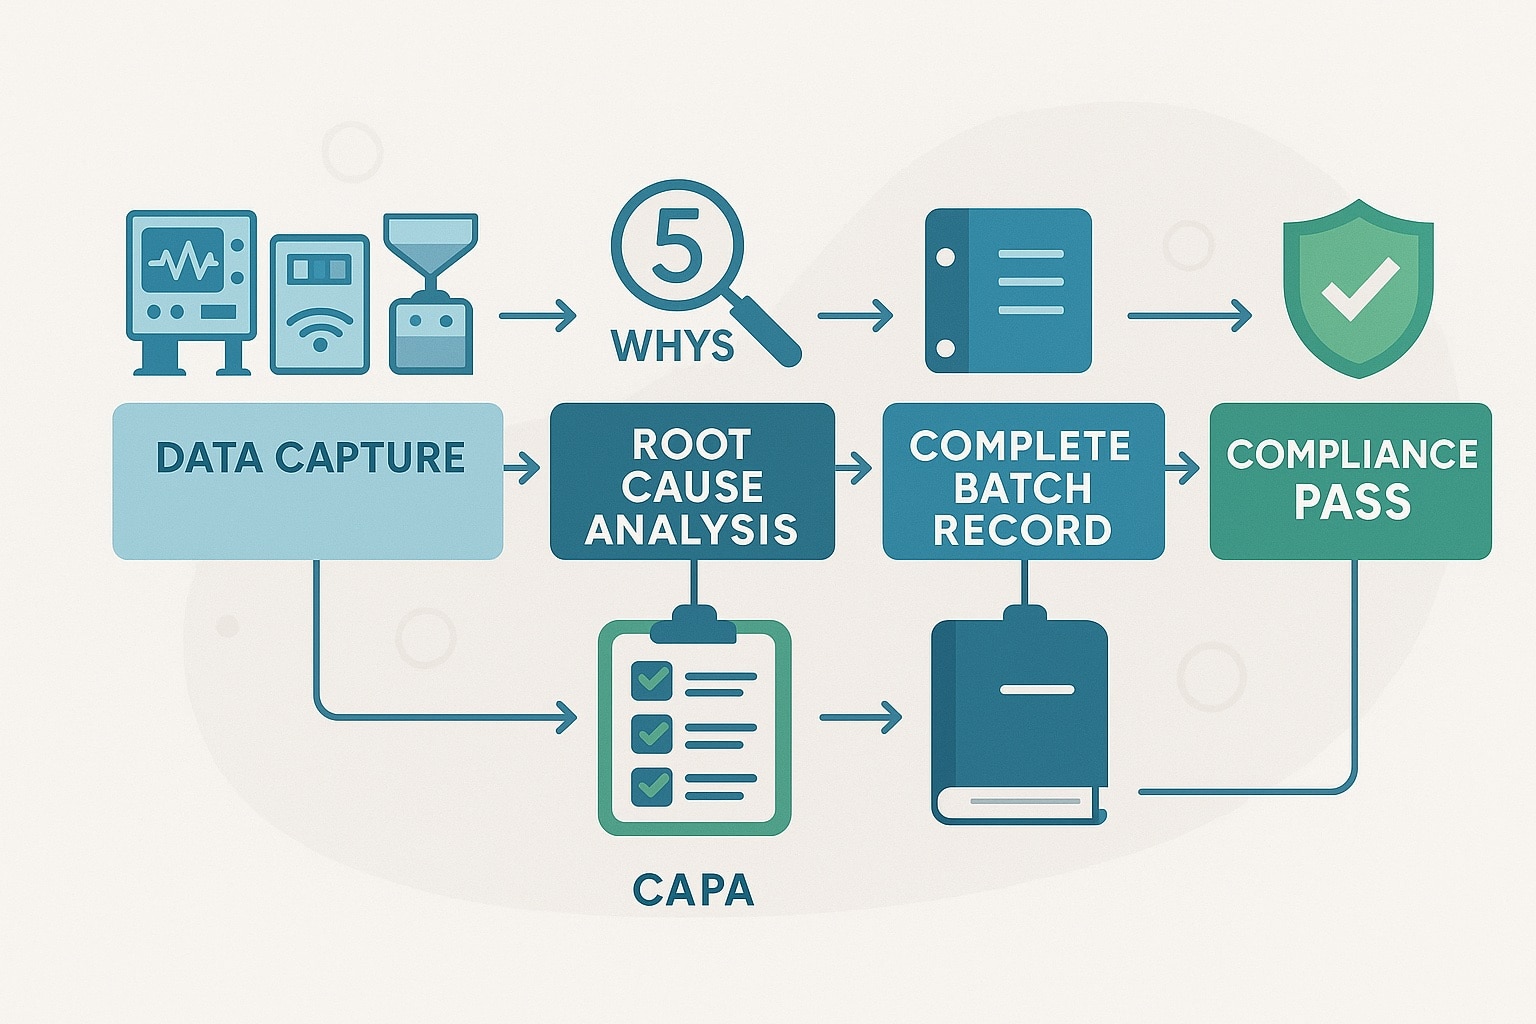
| Stage | What Happens in PRIZ Guru | Key Toolbox Link | Outcome |
|---|---|---|---|
| Detect | AI spots CpK sliding from 1.67 → 1.55 well before spec breach. | Urgency-Importance Matrix | Zero line stoppage |
| Diagnose | Team launches Cause & Effect Chain (CEC), reinforced by 5 + Whys. | Cause & Effect Chain | Root cause in minutes |
| Prevent | Engineers model fixes in 9 Windows and stress-test with Action Preventing Action. | 9 Windows | Permanent, side-effect-free solution |
| Prioritize | Solutions ranked via Round-Robin Ranking for best ROI. | Round-Robin Ranking | Resources focused |
| Learn | PRIZ auto-generates a full 8D-style report, feeding future model training. | Automated Reporting | Continuous-improvement flywheel |
A tier-1 automotive supplier was losing $420k per year to weld-spatter defects. By streaming robot current-draw data into PRIZ Guru, the Early-Warning Model flagged a 3 % drift 18 hours before the defect threshold. Using CEC and System Functional Modeling, engineers traced the issue to a subtle shielding-gas pressure drop. After a regulator redesign vetted through Action Preventing Action, spatter fell 78 % in nine weeks, saving $320k and 620 labor hours.
(Composite of PRIZ-led pilot outcomes; request the ROI calculator for details.)
Q1: What is Predictive QA?
A data-driven approach that surfaces early process drifts and triggers preventative actions before defects form.
Q2: How is Predictive QA different from SPC?
SPC flags violations once control limits are crossed; Predictive QA detects the trend toward a breach, providing lead time for correction.
Q3: Do I need new sensors?
Usually not. PRIZ Guru ingests data from existing historians, MES, or even CSV uploads and adds analytics plus structured problem-solving on top.
Q4: How long to see ROI?
Most pilots recover implementation costs within 2–6 months assuming the implementation of changes takes some time.
Predictive QA isn’t a moonshot. Connect your live data to PRIZ Guru, let the AI surface early warnings, and guide your team, powered by the PRIZ Toolbox, straight to preventative action.
Next step: Book a 30-minute discovery call or start a free pilot on one stubborn defect. Watch Predictive QA stop the blaze before it sparks.