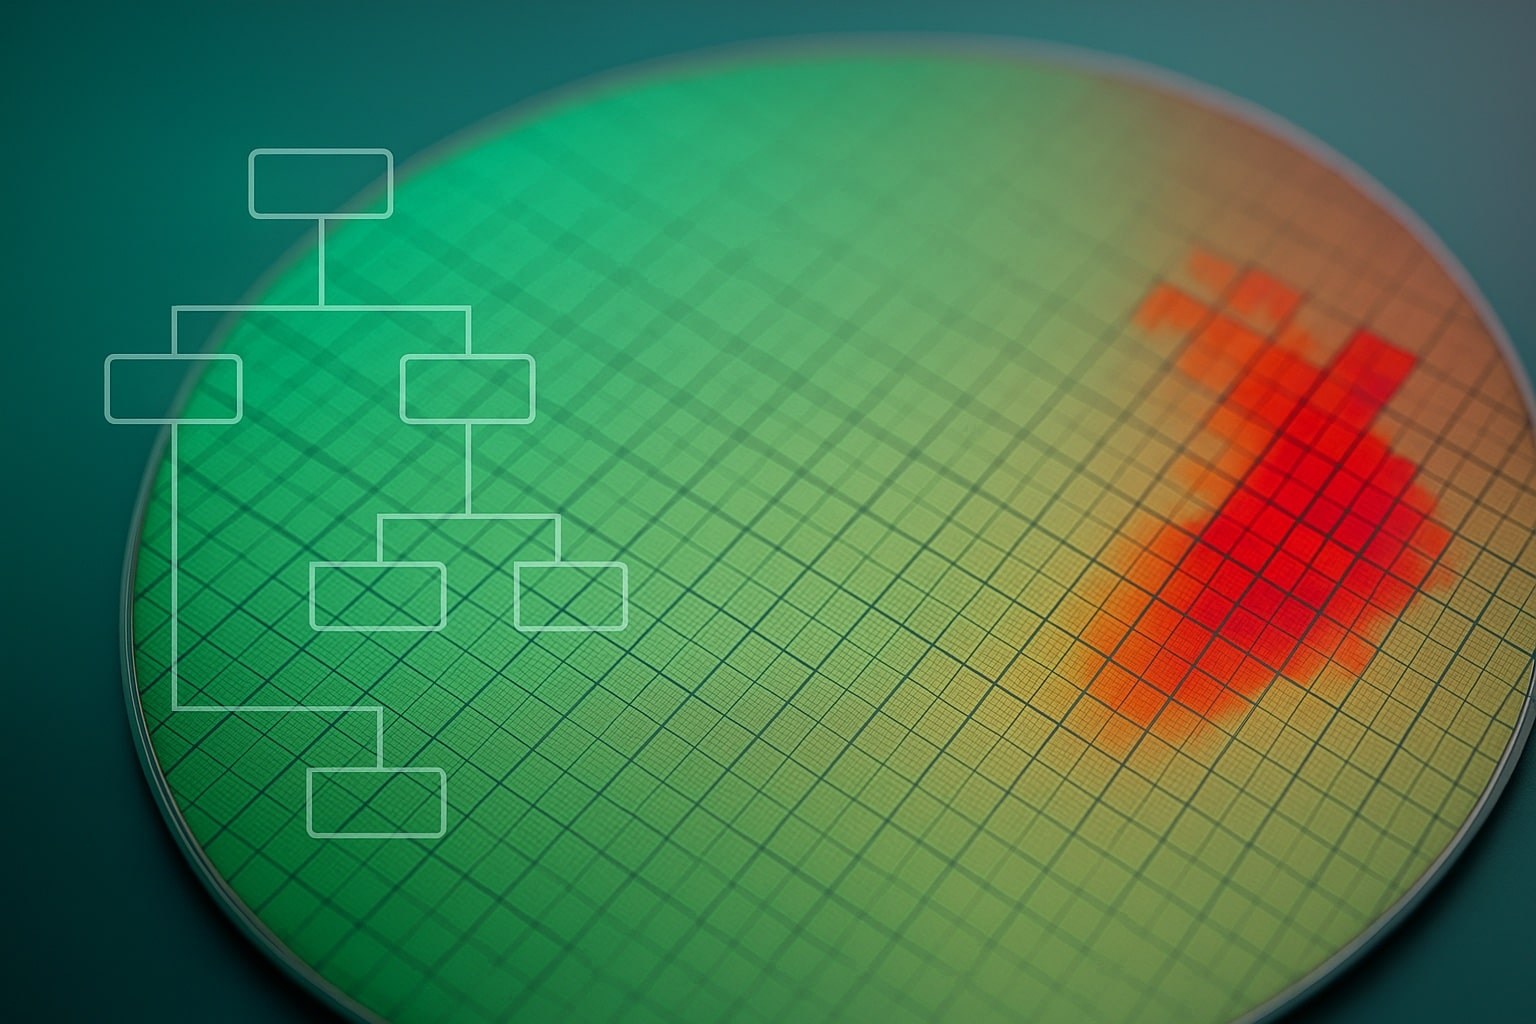
It starts at 02:57 with a single red wafer map in the SPC inbox, then a second lot with the same scratch-like pattern.
By the time the on-call QA engineer reaches the fab, four upstream steps have already processed dozens of wafers. First-pass production yield nosedives 25 %, and material worth ≈ US $17 k per 5 nm wafer is on the line—about US $0.5 million per 25-wafer lot.
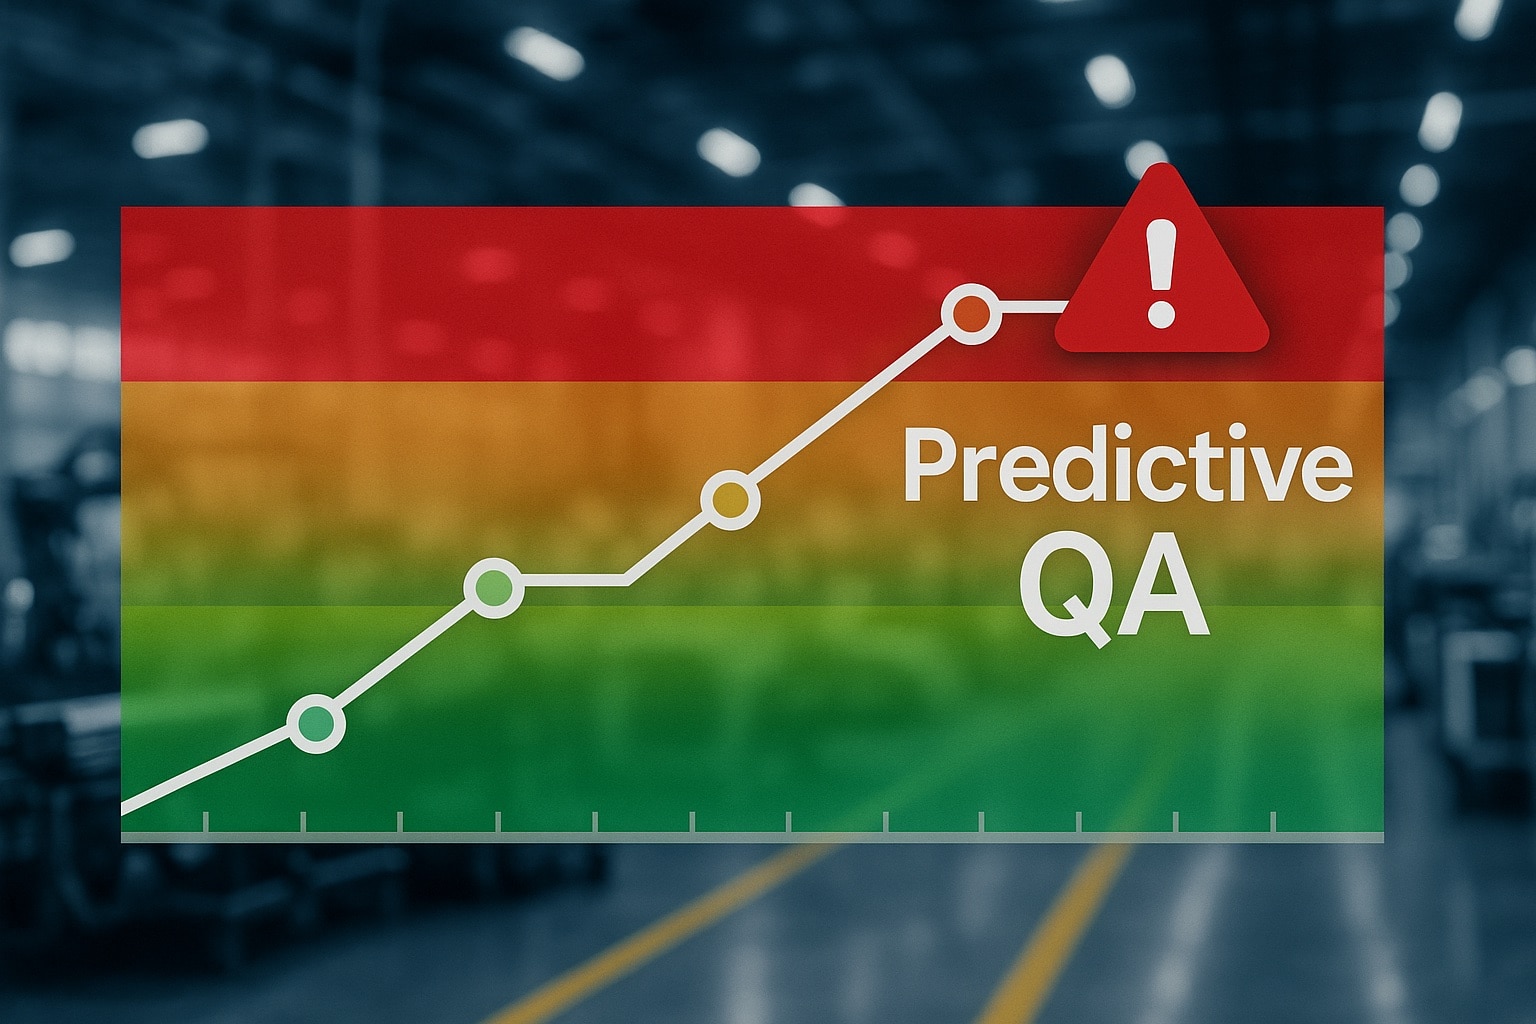
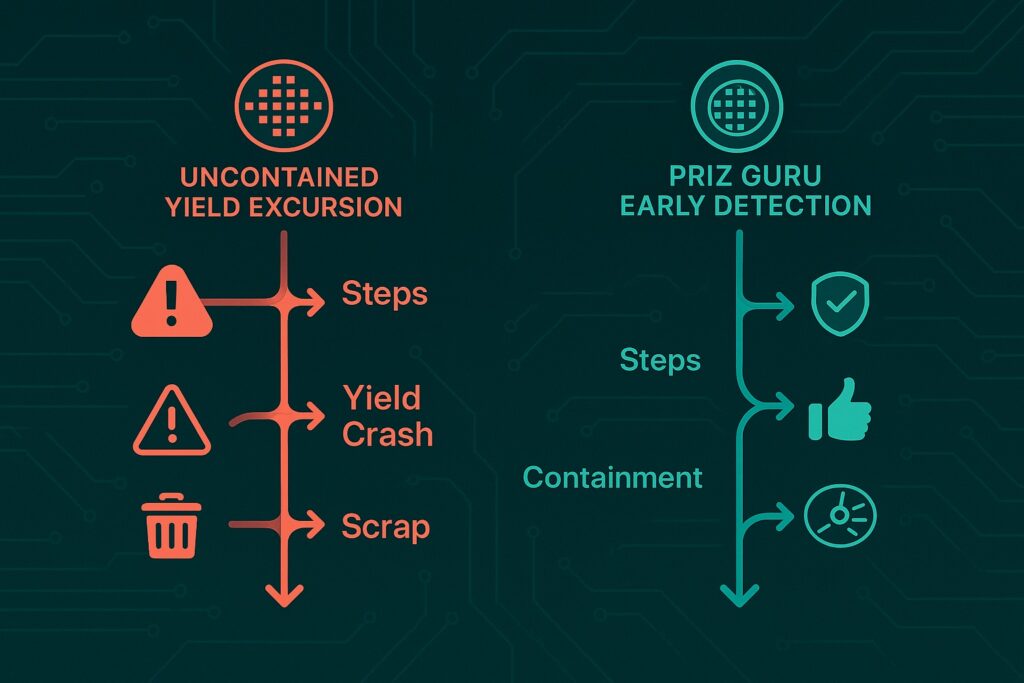
That nightmare is a runaway yield excursion—and it keeps winning because the evidence is scattered across isolated dashboards.
| Everyday reality | Impact on the fab floor | What managers feel |
|---|---|---|
| Fire-drill culture – Patterns appear only after wafers reach the probe or assembly. Teams launch emergency line holds and tool quarantines that idle multi-million-dollar equipment. | Sudden 10–30 % yield crashes force scrap or costly rework; lots queue for extra inspection, blowing Q-time limits. | Margin erosion from lost production yield; frustration that expensive analytics still don’t “talk.” |
| Fire-drill culture – Patterns appear only after wafers reach probe or assembly. Teams launch emergency line holds and tool quarantines that idle multi-million-dollar equipment. | WIP bottlenecks, overtime, and “ship-hold/ship-rework” decisions sap morale. | OEE plunges; board-level reviews ask why QA was blindsided—again. |
No other industry combines this precision, data volume, and financial exposure so brutally.
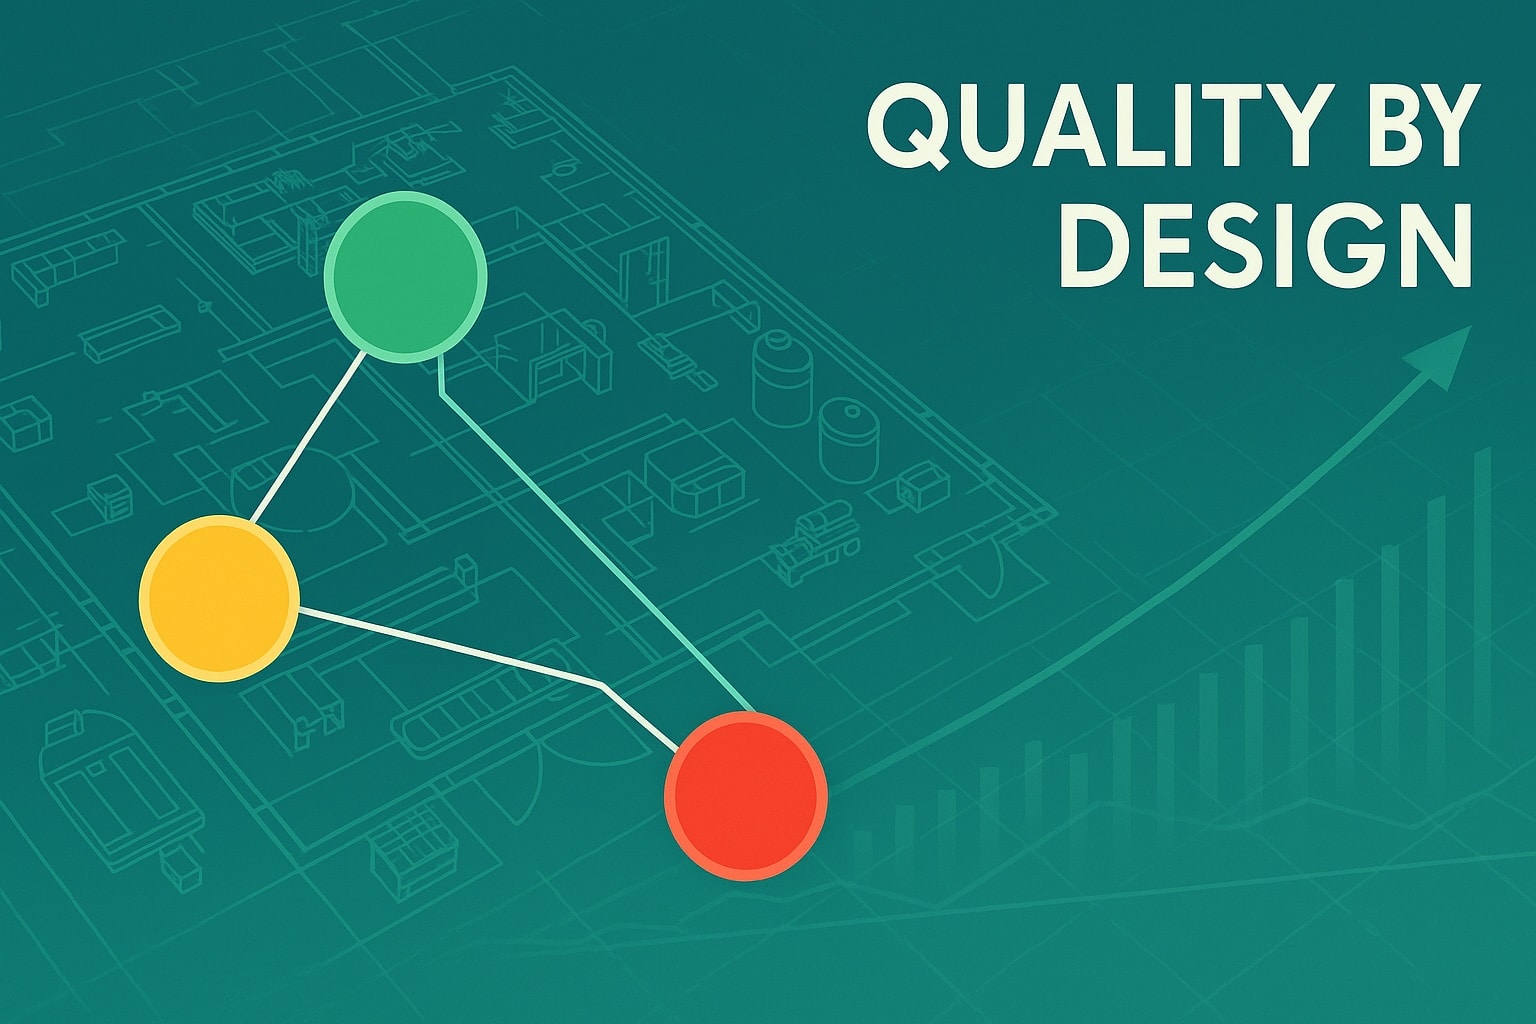
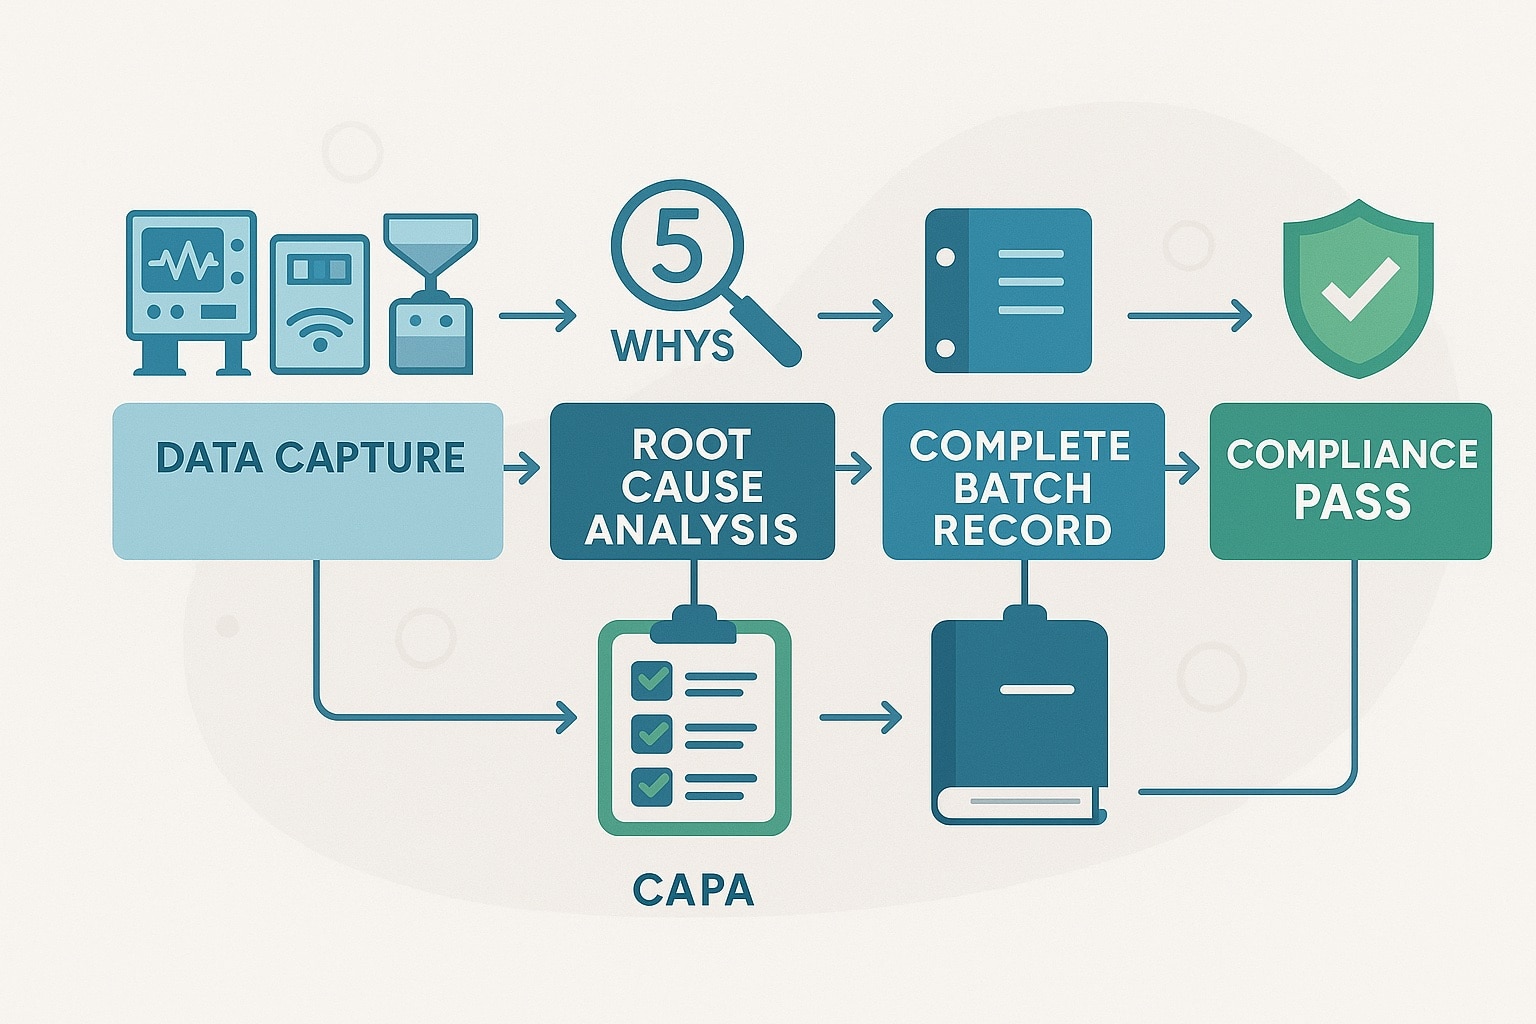
The fix is not another dashboard—it’s a structured, cross-stage workflow powered by PRIZ Guru’s creative-thinking toolbox:
| PRIZ Tool | What it does in a semiconductor fab | Result |
|---|---|---|
| Cause and Effect Chain (CEC) + 5 + Whys | Builds a logic tree from wafer-map symptom down to the true physical mechanism (e.g., bevel scratch from contaminated chuck) in hours, not days. | First containment actions launched before the excursion propagates. |
| Process Functional Modeling (PFM) | Maps every operation the wafer experiences; highlights where particles, chemistry, or charge can transfer between steps. | Engineers see hidden transfer paths that SPC charts miss. |
| 9 Windows + 40 Inventive Principles | Forces teams to zoom out in time/space and generate counter-measures (e.g., sacrificial edge bead, bevel-clean redesign) beyond “tweak the recipe.” | Breakthrough fixes that prevent repeat excursions instead of patchwork. |
| Round-Robin Ranking (RRR) | Ranks multiple corrective-action options based on impact, cost, and risk—fast. | Management aligns on the best fix without endless meetings. |
| Automatic Audit-Ready Reports (built-in) | Generates 8D/CAPA documentation as engineers work. | Release quarantined tools sooner; satisfy customer PPAP/PCN instantly. |
| AI-Assisted Facilitation | Guides junior engineers through each tool’s logic, leveling up QA skills on the job. | Expertise scales without waiting for scarce Six-Sigma black belts. |
Early adopters slashed isolation time from > 72 h to < 24 h, prevented an estimated US \$2 million scrap event, and freed litho capacity—without adding headcount.
Book a 30-minute walkthrough of a live wafer-defect case in PRIZ Guru and see how CEC, PFM, and 9 Windows can lift production yield and future-proof your QA operation against the next yield excursion.