
The expenses on R&D is the most popular indicator of company innovation level. And many organizations are following that. They dump money on R&D with the hope to innovate more. But the question is, Is there a correlation between innovation rank and R&D expenses? There is a lot of related information you can find on the web, we, however, made our own analysis that confirmed that high R&D spending does not mean high innovation level of a company. In short, you can’t buy yourself an innovation. High innovation rank at low R&D cost should be the preferable target for a company. The application of creative thinking approaches and problem-solving tools are necessary to achieve this target.
So, what can we do to increase the innovation level of a company? In many cases, the recommendation will be to increase investment in innovation (or in R&D). And, this is what typically happens. Companies increase their investment in R&D year over year.
The chat below, show just some examples of companies with constantly increasing R&D expenses:
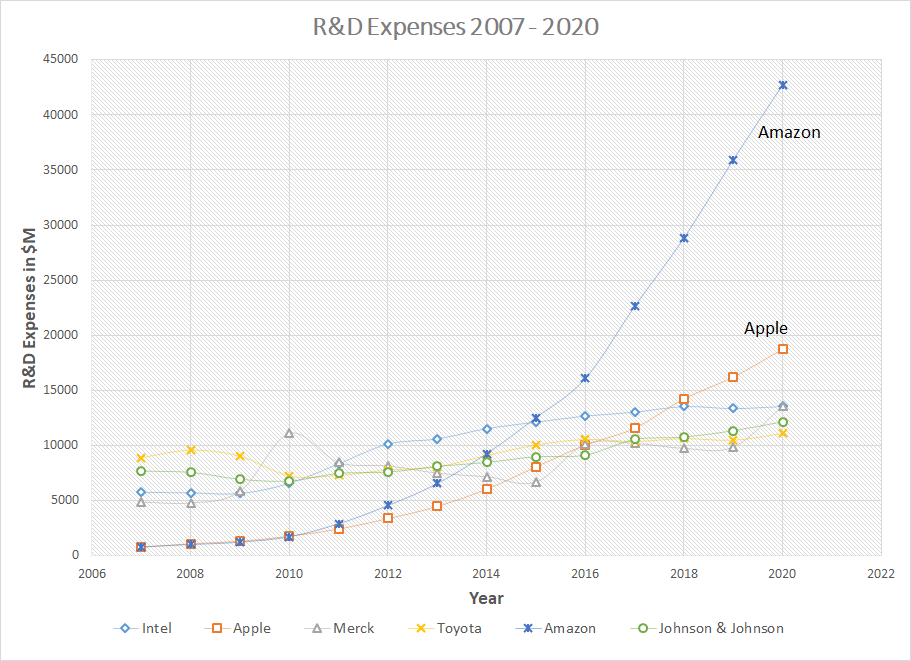
Ref: https://www.macrotrends.net/stocks/charts/INTC/intel/research-development-expenses and https://www.statista.com/
Since the companies are rated according to spending on R&D, is it good enough to spend more on R&D projects to be innovative? Not really. According to the analysis published in Innovation Versus R&D Spending the R&D spending is not the driver of innovation.
We performed the analysis impact of R&D spending on Innovation rank for 2018 (to avoid data bias by the pandemia). We took into account about 40 high-end innovation companies.
We incorporated all the data and built the chart showing Innovation Rank versus R&D Intensity (Annual R&D spending/Annual Revenue, in %).
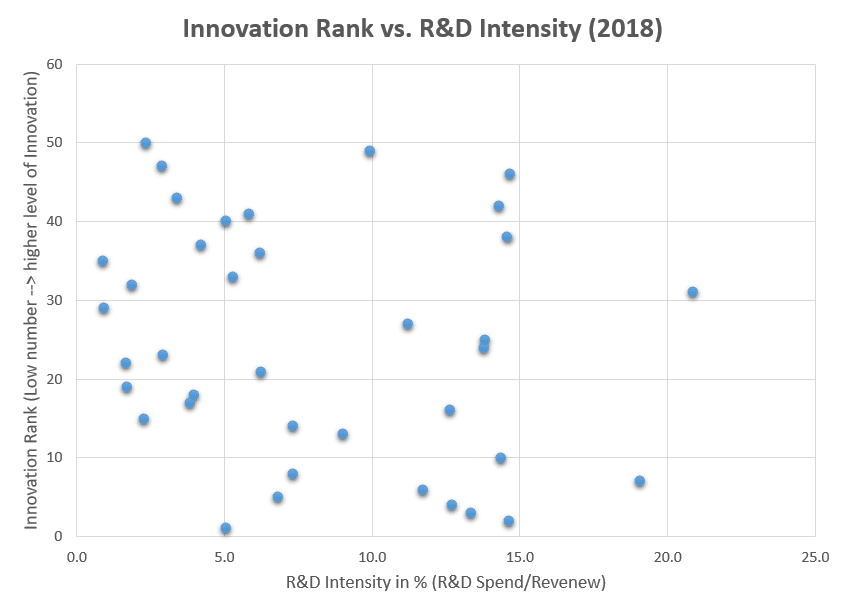
As one can see, there is no real correlation. Let’s try, however, to make some more sense out of this chart.
Let’s modify the chart to make it useful for our analysis. If we apply logarithmic axes and invert Innovation Rank because low numbers correspond to better innovation performance (higher level of innovation), we will get the chart as shown below:
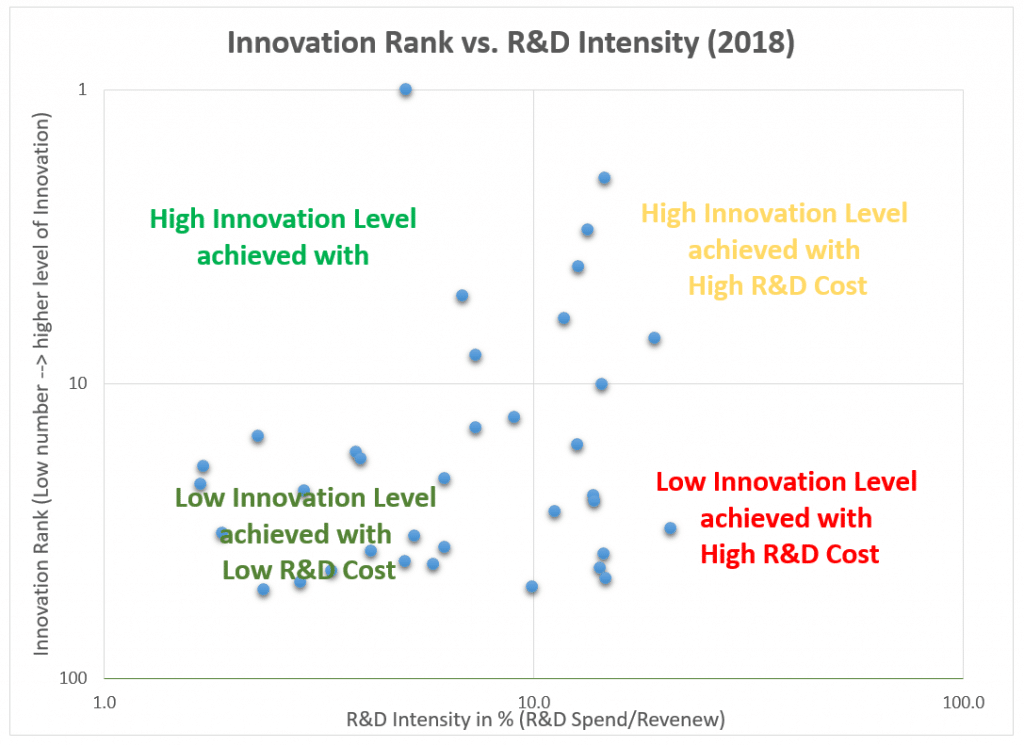
The chart separates all the companies into for groups.
Now, this chart looks more informative.
We split the entire area into four fields:
To summarize, the recommendations for each field is shown below:
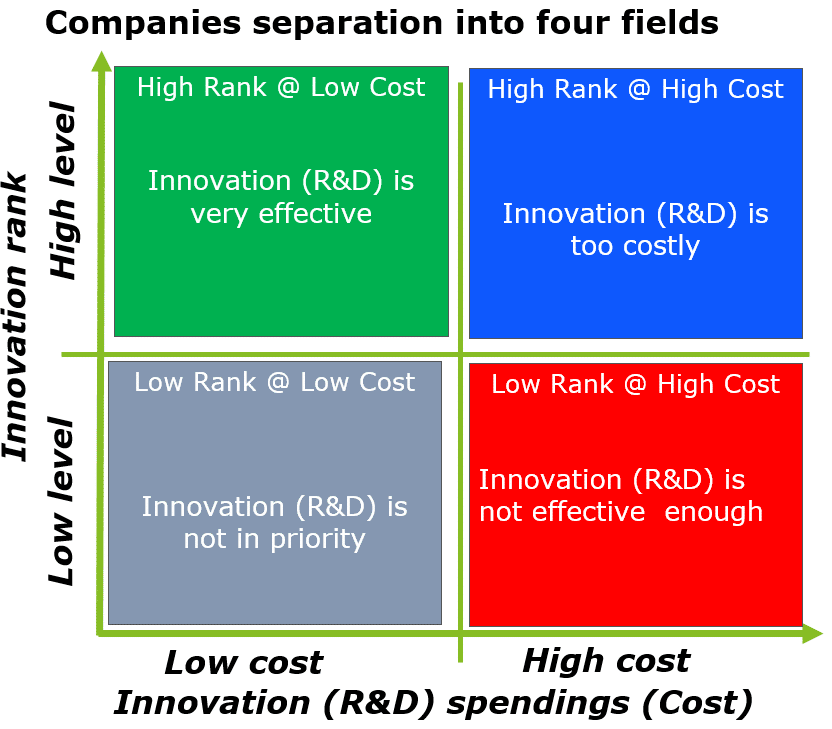
The chart below shows companies in the different groups according to the Innovation Level and R&D Cost:
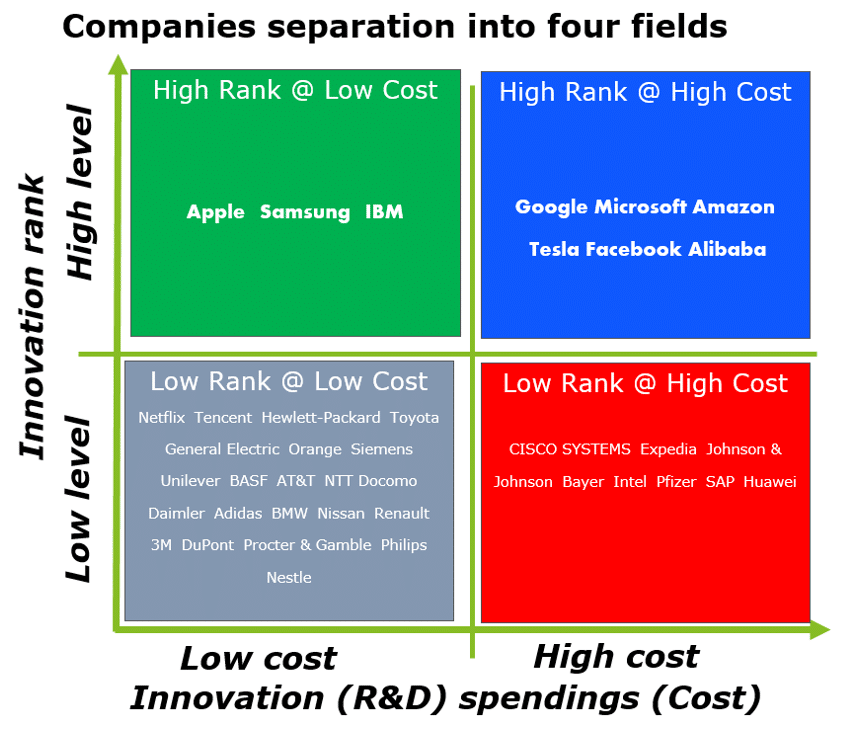
The top-left (green) field is the most preferable and profitable. The companies in this group manage the R&D very effectively.
So how do we move there? Well, it is necessary to make R&D less costly and more effective. But, how? A couple of recommendations here:
Contact us for training, consulting, coaching or any assistance.
It is free!
Good Luck


Evgeny Medvedev
June 8, 2022
Thanks a lot!
Very interesting and useful ideas. It is always informative to talk to you and read your articles.