Perception Mapping (PMap) is a creative thinking tool that helps to find blockers. But first, we should define what the blocker is. This help article describes step-by-step instructions on how to use the perception mapping tool, find blockers, and achieve your next goal faster.
Let’s assume that we need to achieve a certain goal. In order to achieve this goal, we have to perform a number of actions (or perceptions). However, one or more of these actions might prevent us from achieving the goal. These actions are called blockers.
Thinking about some simpler cases, it might look like identifying the blocker is pretty fast and easy. One might even think, “Why would I use any tool for it?”. However, when we are talking about more complex systems, goals that we have to achieve under time constraints or simply be more efficient in our processes, usage of a systematic tool becomes much more imperative.
The Concept
Conceptually, perception mapping is very simple to use; though it requires a good knowledge of the system you are working on, so you (or your team) can identify all the perceptions.
- Collect perception
- Map perceptions
- Analyze the results
Using Perception Mapping
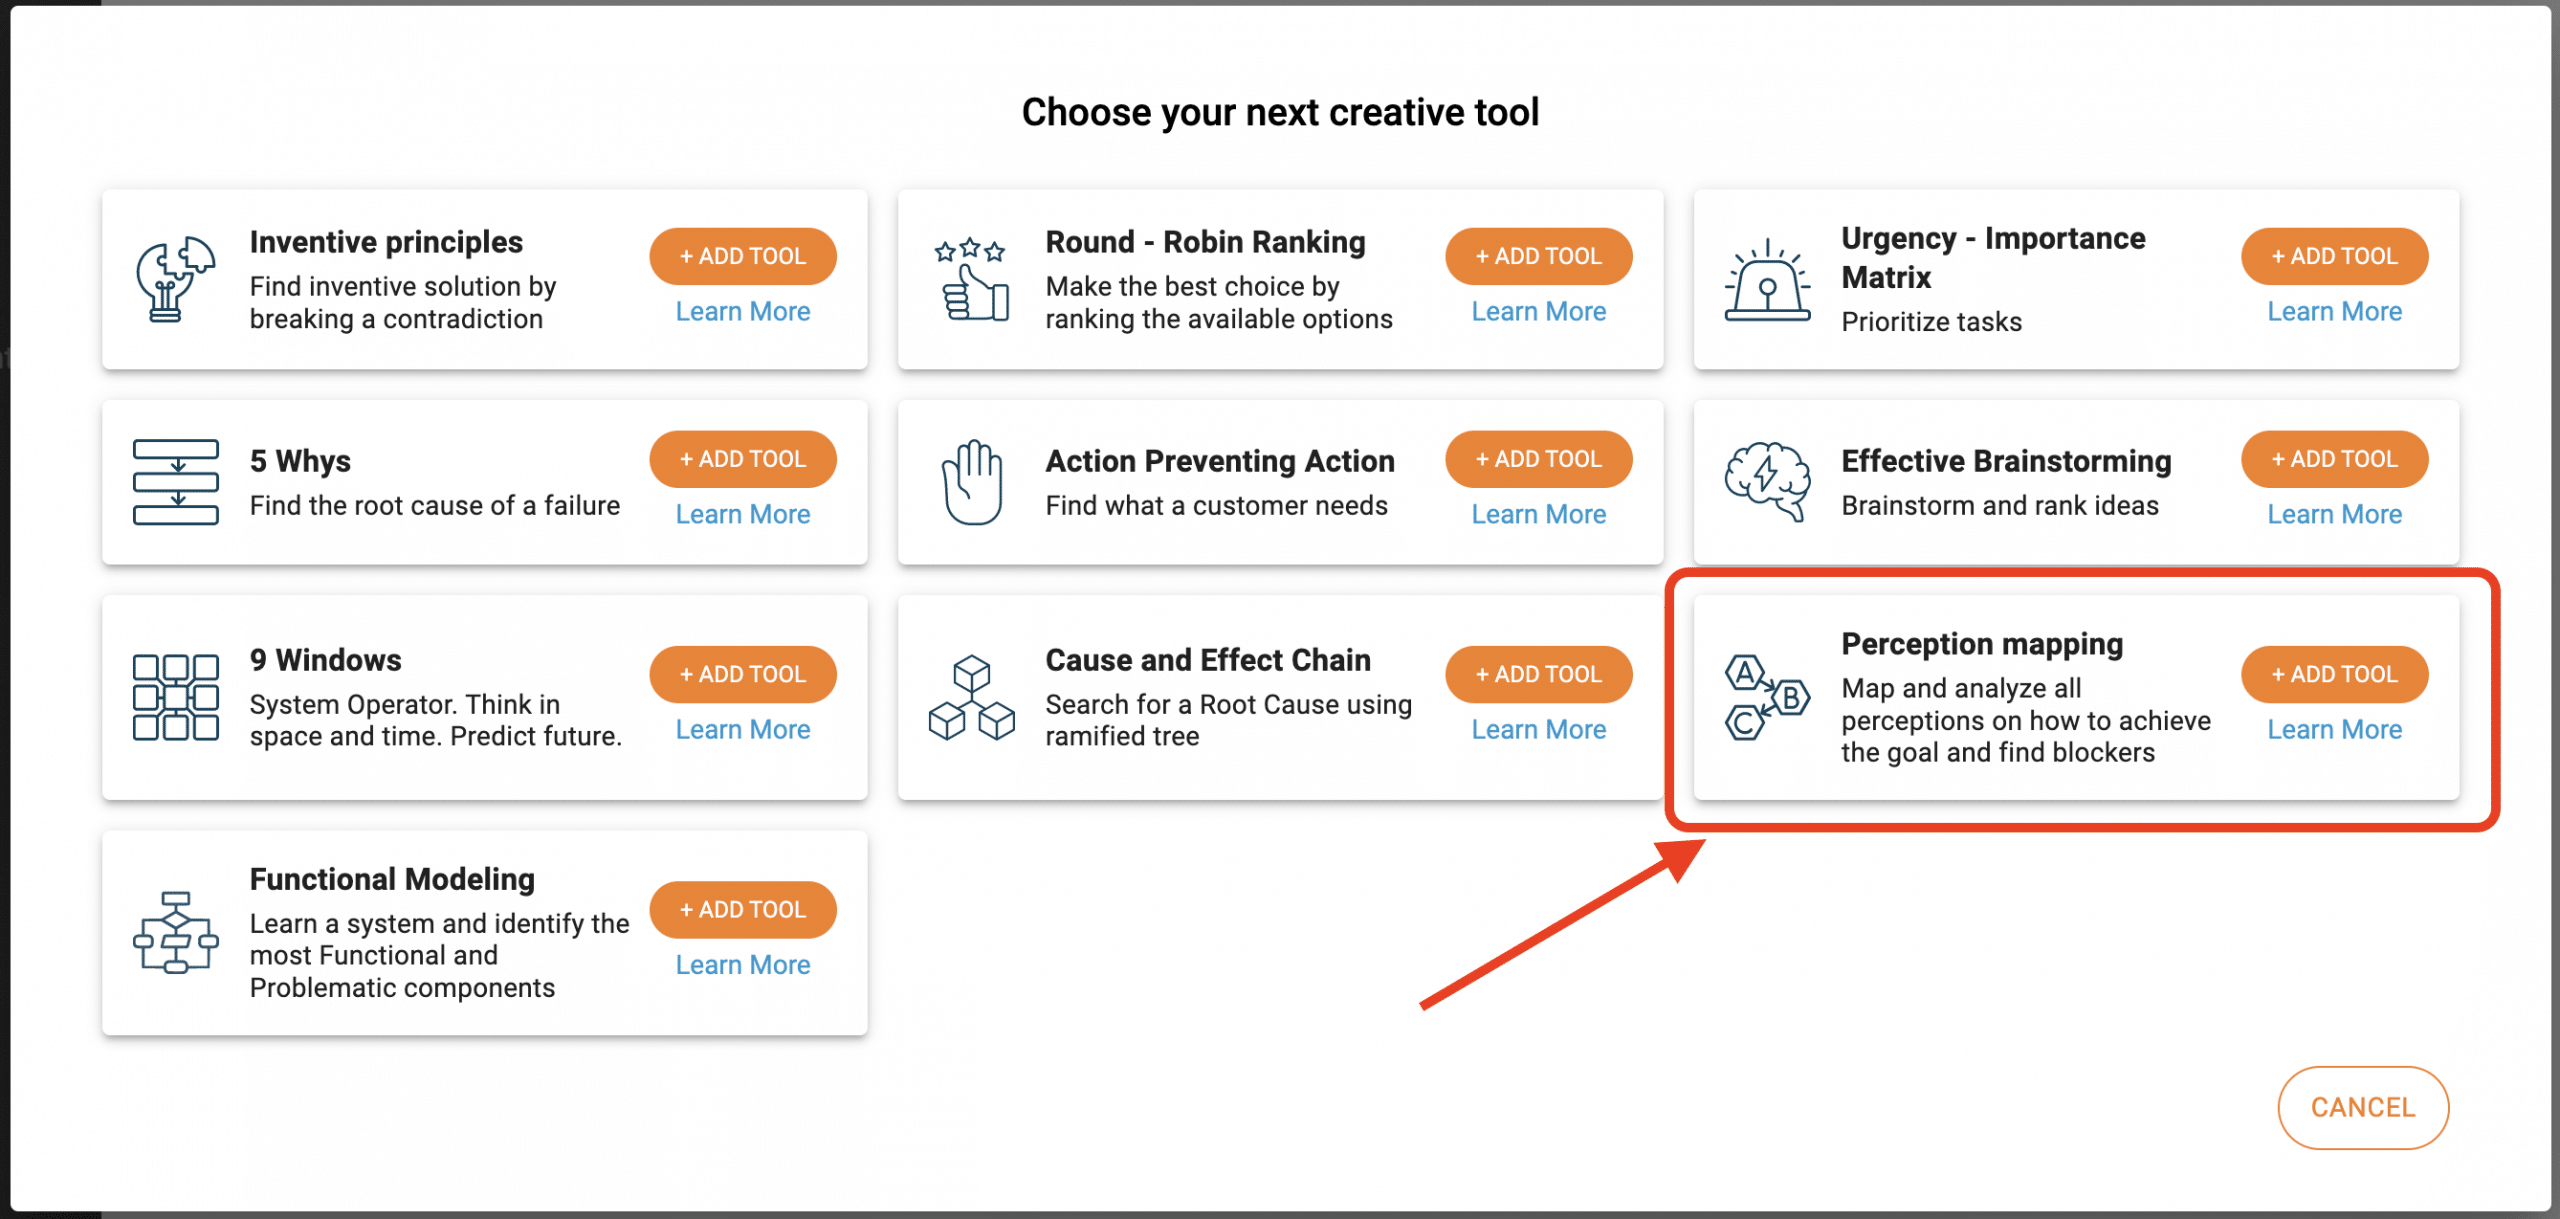
Here, we assume that you already know how to start using a new tool. For more information about that visit Creative Tools article. Perception Mapping is one of the available tools in the PRIZ Innovation Platform.
Once the tool is created, you will be redirected to the tool itself.
Similar to many other tools, Perception Mapping has a number of sections:
- Subject – a free form description of a subject (system, problem, situation, etc…) that you are planning to analyze
- Perceptions – where perceptions are collected
- Result – automatic calculation and presentation of results
- Conclusion – free form description of any conclusions that came out of the analysis
Subject
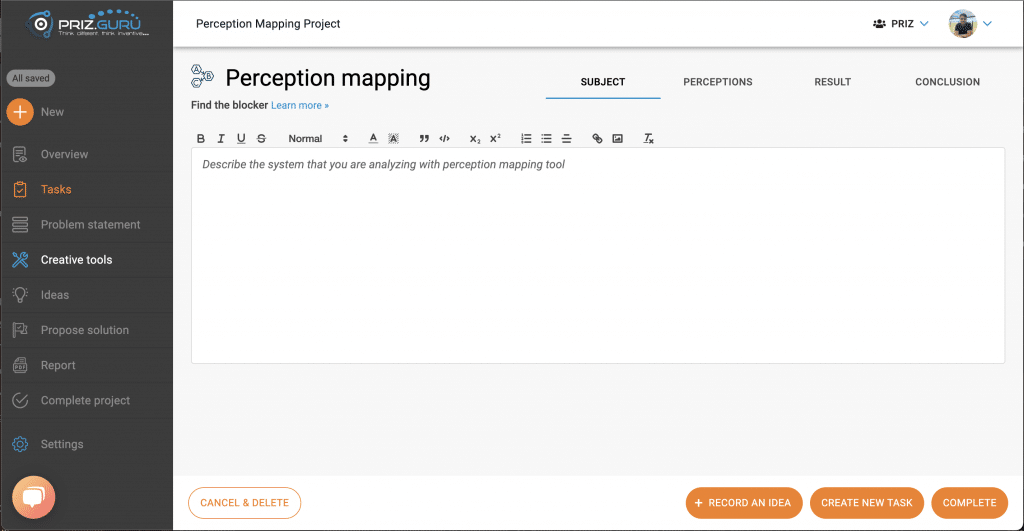
The subject is a generic name for anything that you are analyzing with the help of any tool. It could be a piece of equipment, a description of a system or a process, current situation that you are trying to change or improve. The subject is any information that may help you and your team to come up with perceptions. It is a free rich text editor and can include anything including images, links, and any formatting the editor allows.
Keep in mind that any thinking process can be very dynamic and often change direction. This is normal, and when you analyze your subject, you might remind yourself of something that you didn’t think about at the very beginning – a piece of a system,a step in a process, and other details. While using perception mapping, don’t worry about filling everything perfectly from the very beginning; you can always come back to the subject description and update it.
The thinking process is unpredictable, hence we made this information available and as close as possible to the tool you currently use.
Perceptions
Perception is another generic term and is best explained by example. Imagine that you and your team are planning complex equipment maintenance, systems migration, or anything that requires several steps to complete. These steps are basically actions that one needs to perform to get closer to the completion of a goal. Each and every one of these actions is also known as perception. The reason for using a generic name is mainly to avoid narrowing of thinking to actions only, and instead of asking “what needs to be done?”, you should ask “What is needed?”. Often, however, people simply treat it as actions, which is not wrong as well.
Once the tool instance is just created, there are no perceptions defined. As shown in the screenshot, all you have is a placeholder for the first one.
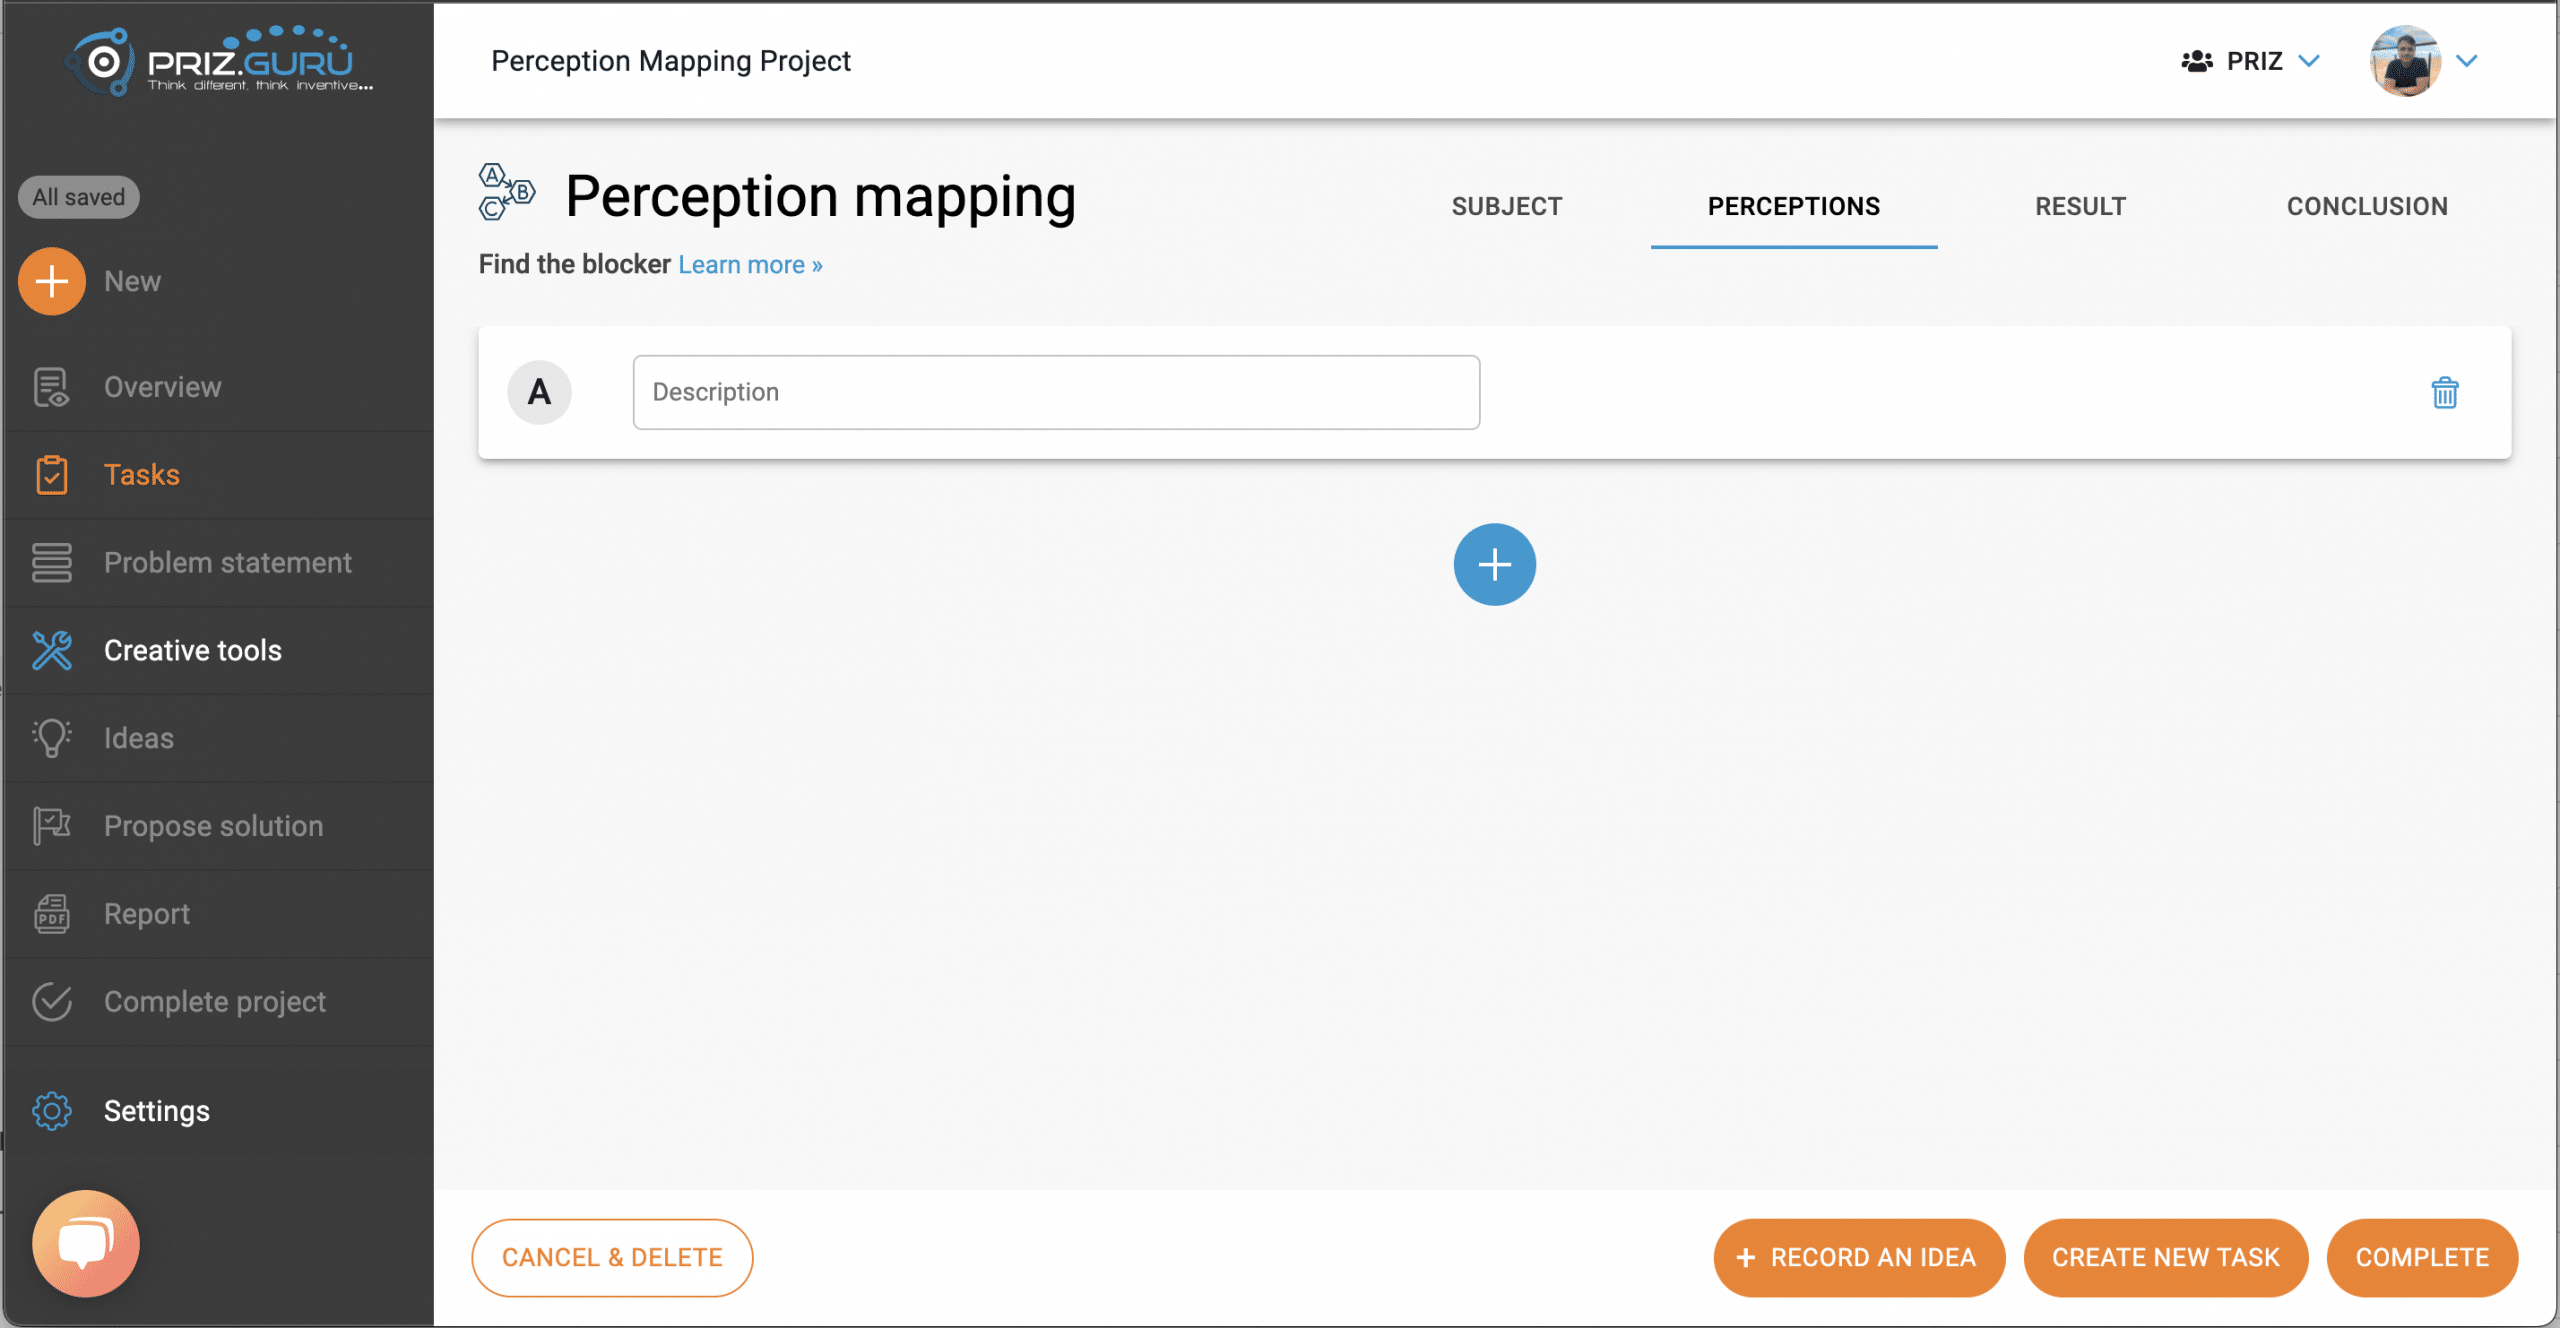
Define Perceptions
To define perception, all you need to do is write its description. The data will be automatically saved as you progress.
To add more perceptions, simply click on a big plus button at the bottom of the list and add a description for each. The resulting list of perceptions might look something like this.
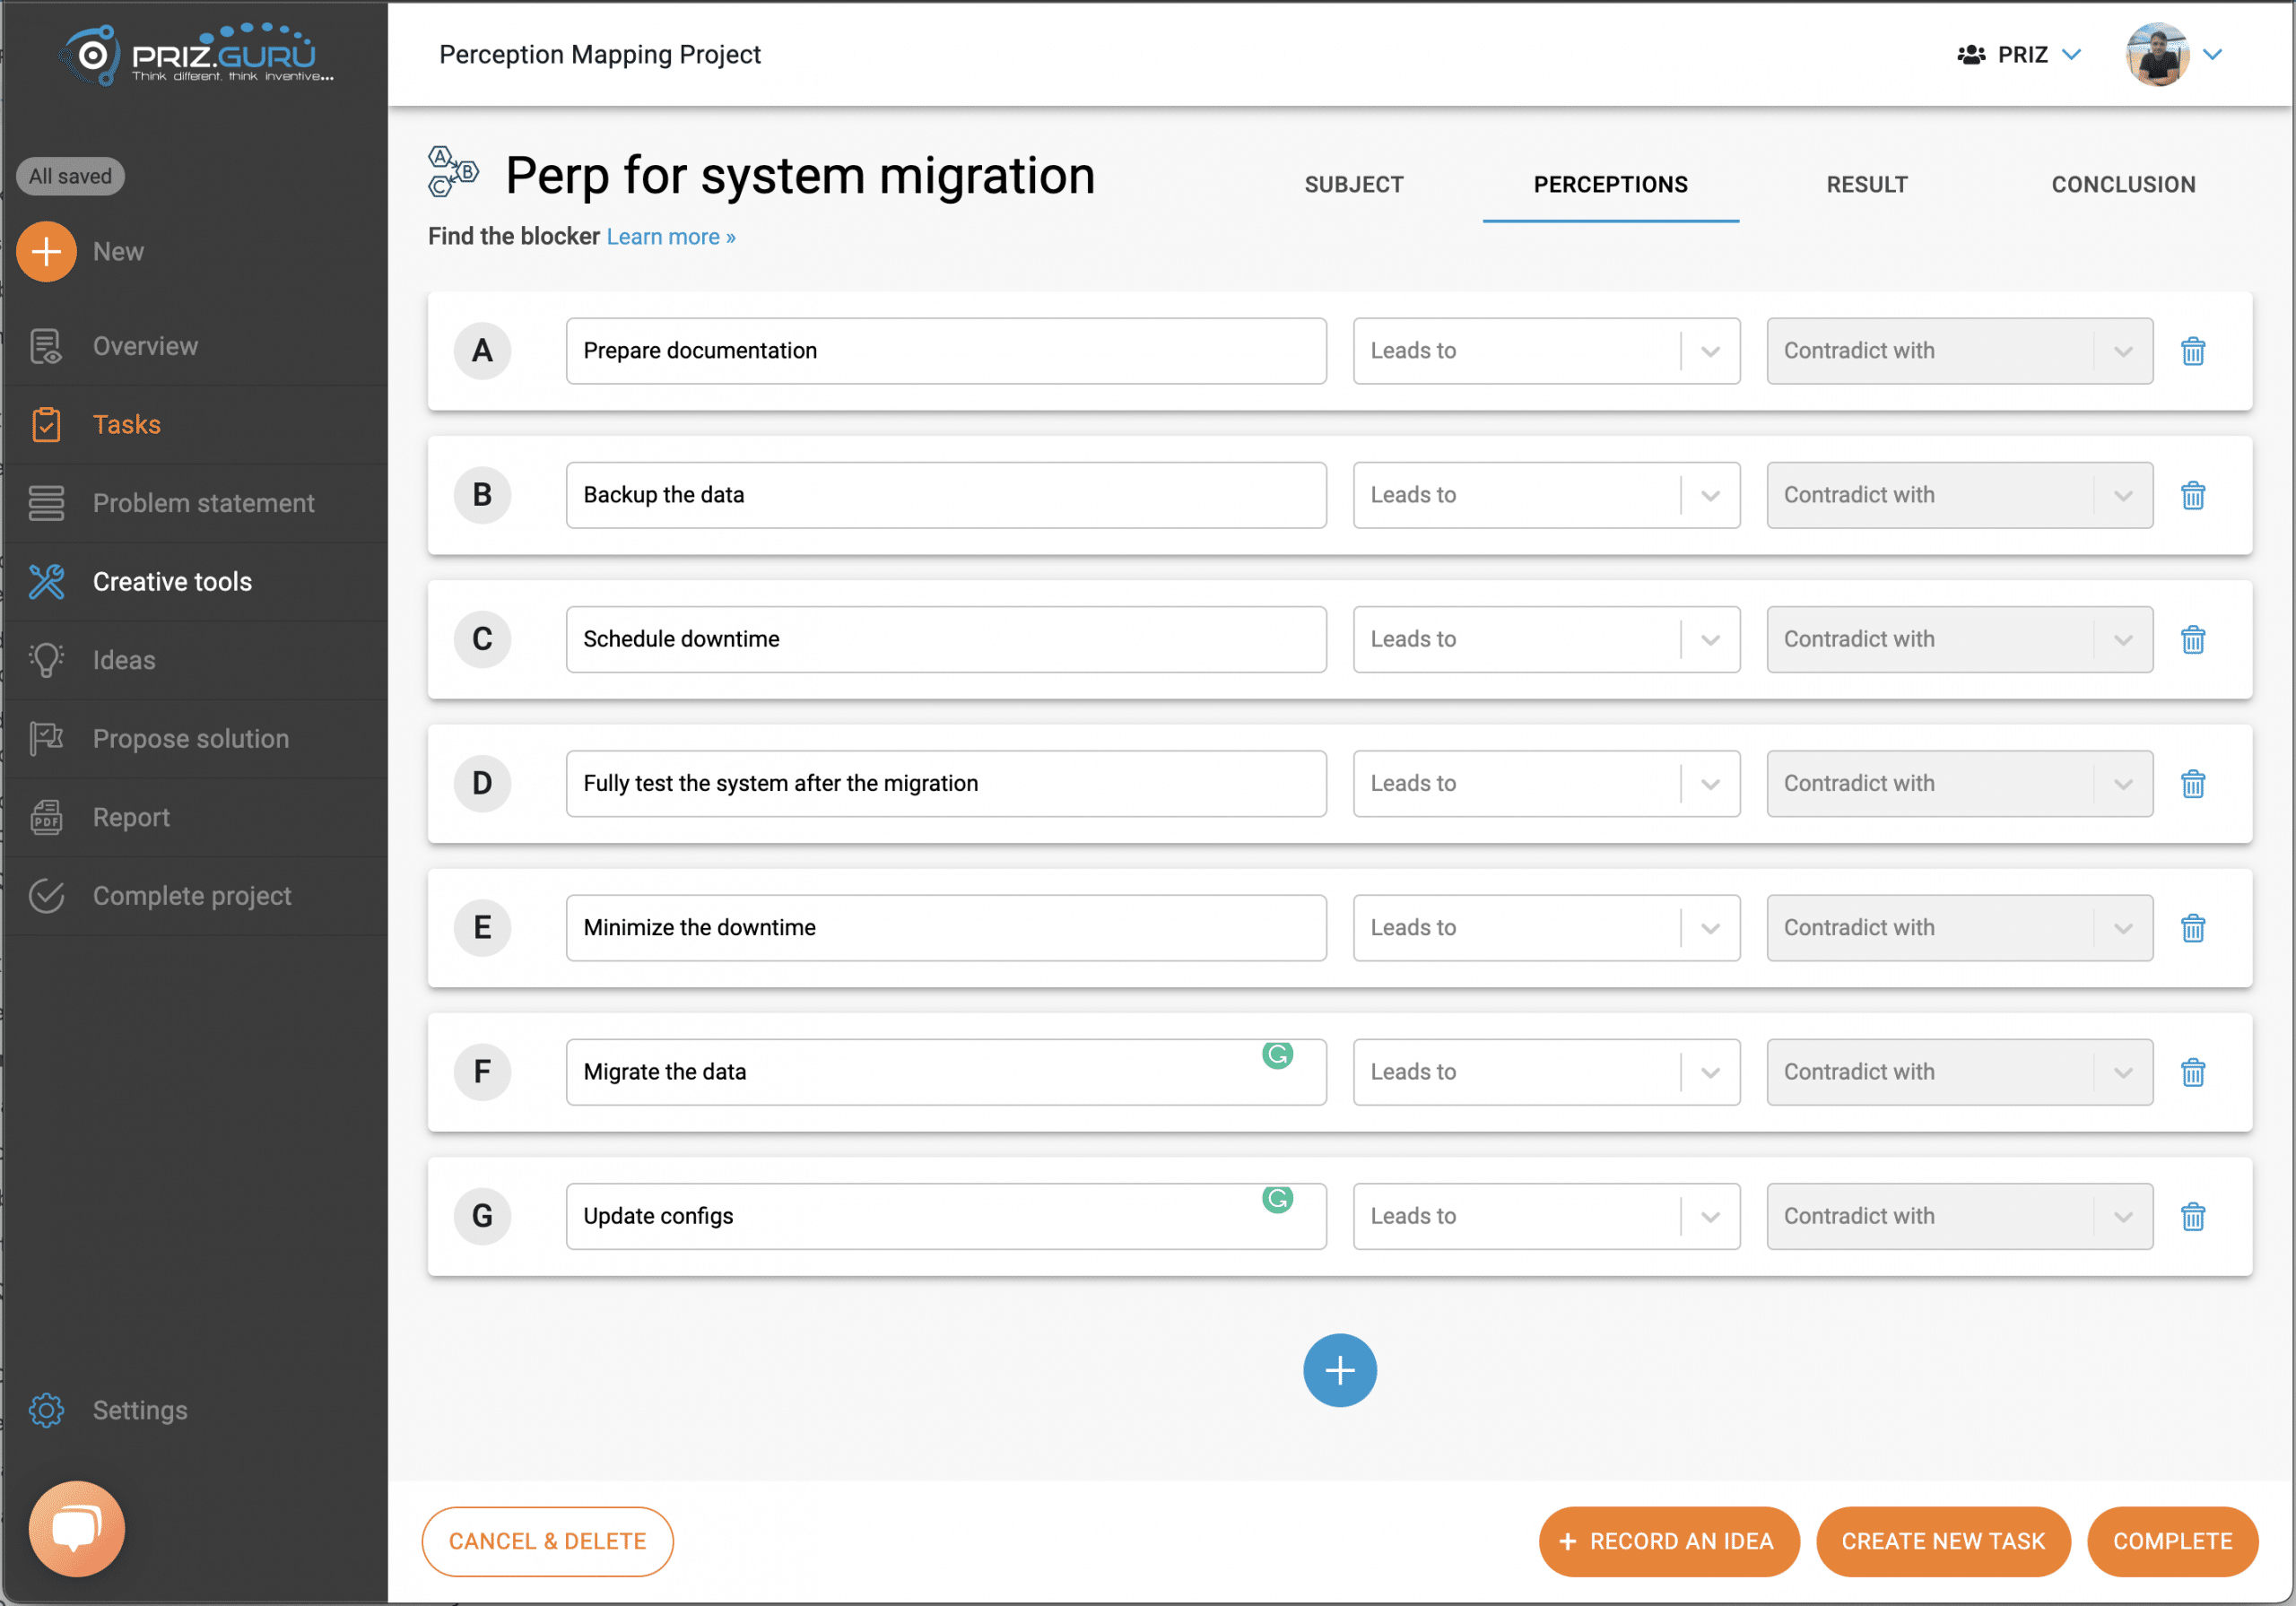
In the example above, we want to get prepared for system migration. Of course, this is a very simplified list. In a real-life, it can get much more complex and much longer. The most important here is to list everything that the team might think about. Even if it’s something minor, something that you might think is not important or obvious. That minor perception can also become a blocker for the whole operation.
Map the perceptions
This phase is when the mappings are supposed to happen. But first, let’s discuss the two types of required mappings.
- Leads to – the meaning of leads to is when the completion of one perception allows another. For example, if you need to have the key to open a door, “having the key” perception leads to “open the door”.
- Contradicts with – in some cases, perceptions can be contradicting to each other. For example, “Ensure quality” and “Keep the cost down” are contradicting.
Use the two dropdowns available for every perception to define both types of mappings. The “Leads to” mapping is required – meaning that every perception has to be mapped to or from for the perception to be taken into account. “Contradicts with” is optional, and perception does not have to contradict any other of the defined perceptions.
For the sake of this tutorial, the mapping might be as follows.
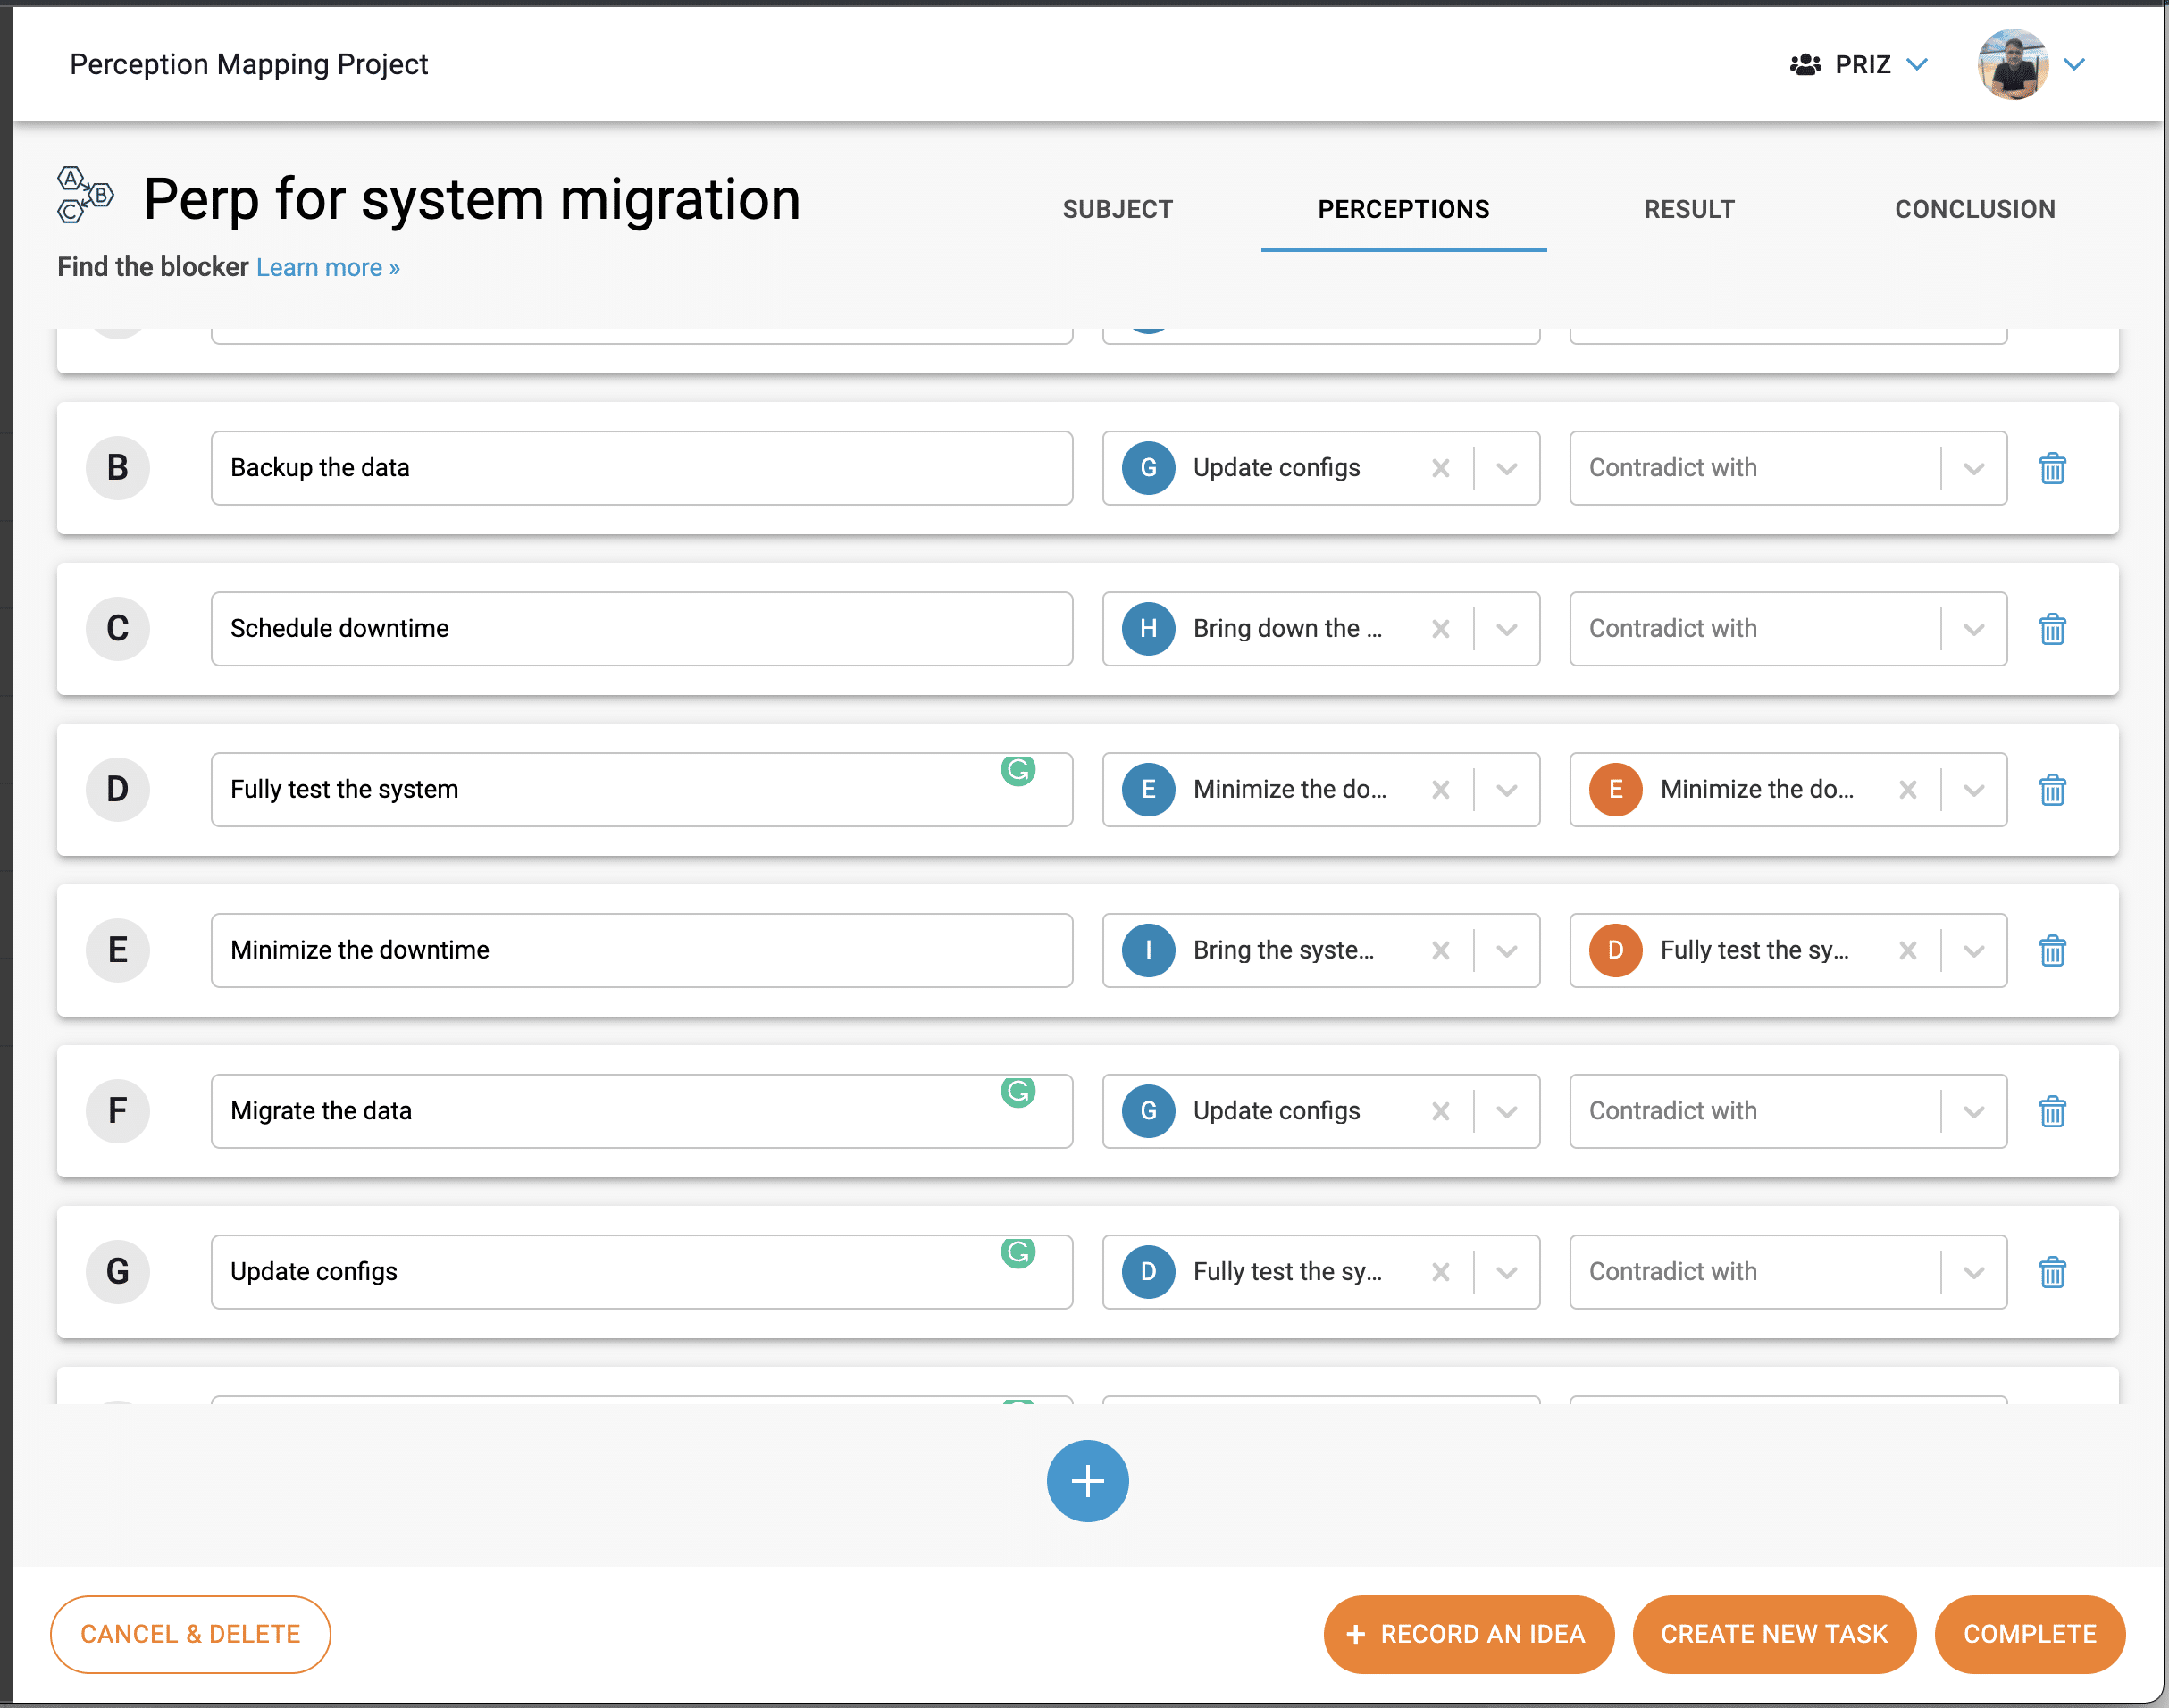
While working on the mapping, we added some more perceptions. That is completely normal and expected. Once you start thinking about what leads (allows) what, you often realize that steps got missed. Nothing should stop you from adding them to the list.
Results
Once you finish with all the mappings, you can get some meaningful results. The result tab shows the calculation of all the rankings. The perceptions with the highest blocking rank are the ones that you need to make sure to take care of first. Without them, the entire operation cannot proceed. In other words, these perceptions are blockers.
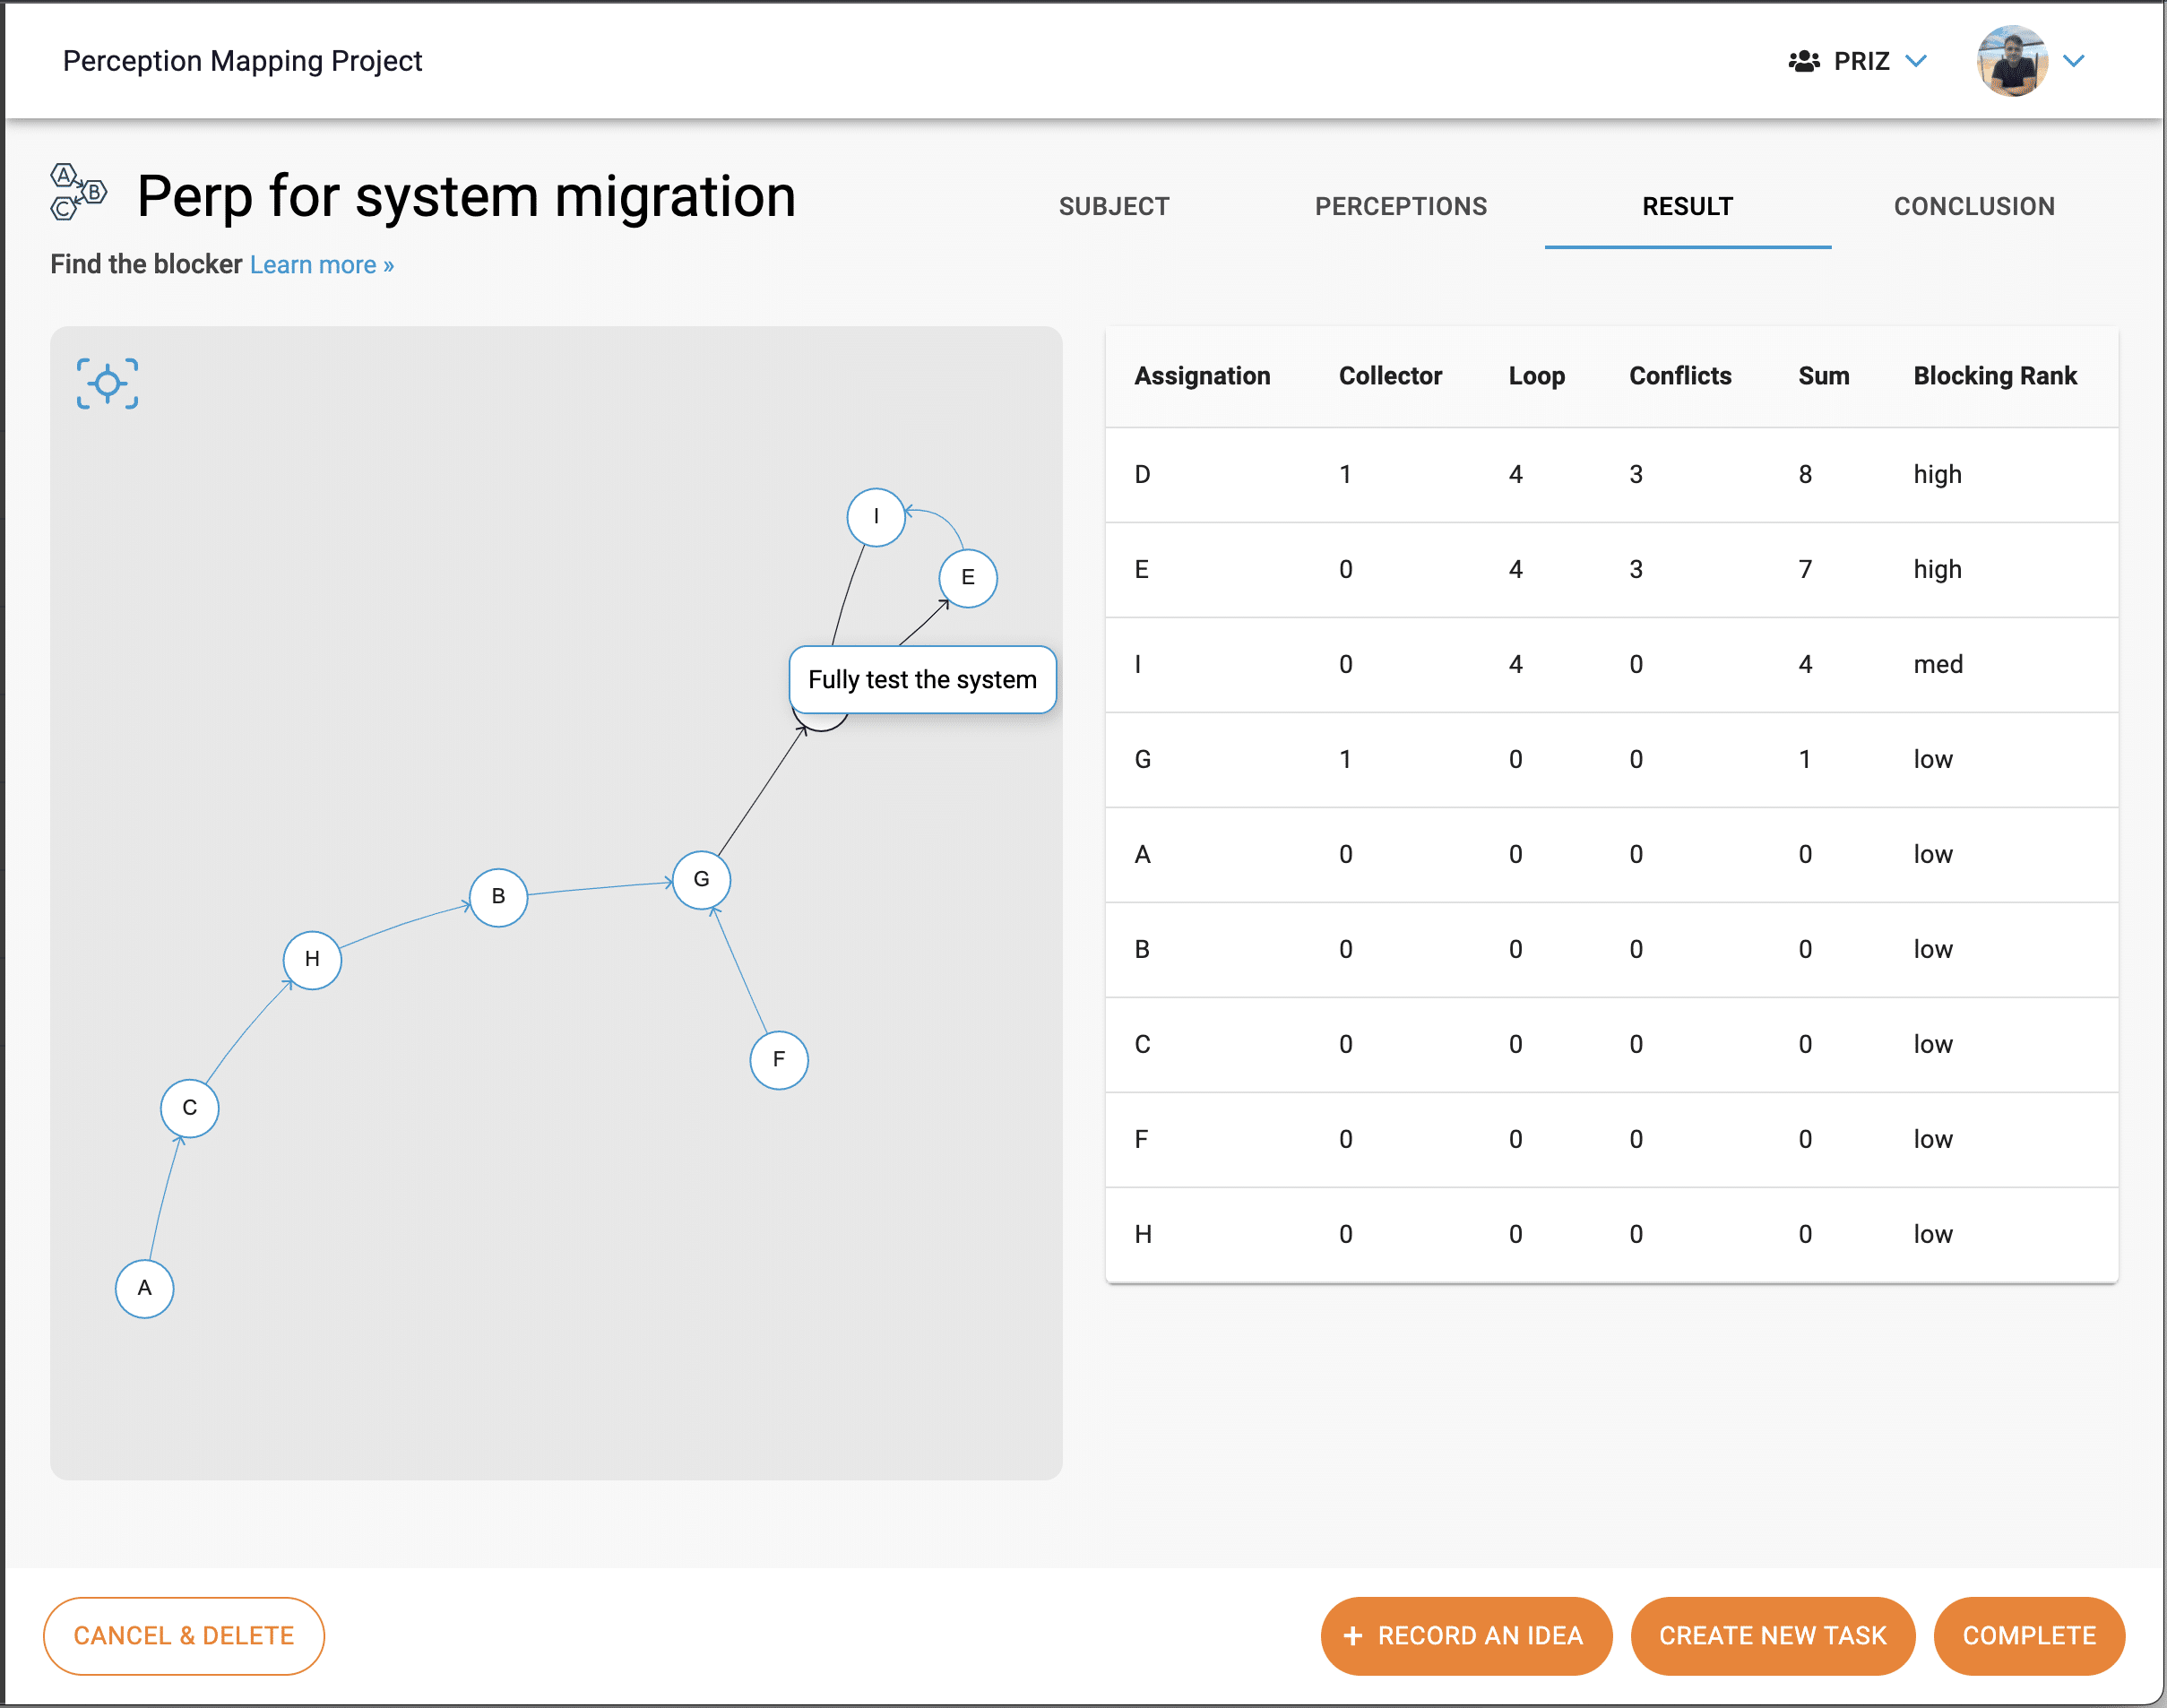
The result tab has two parts. Visual representation of all perceptions and mappings on the left (the chart). The calculation of blocking ranks on the right (the table).
For our example, the result above clearly shows that perception D (Fully test the system) is shown as a blocker. If you think about it, for this type of migration, as long as you are not capable of fully testing the system, you are better off not even doing the migration at all. If you are not able to test the system, eventing else is not important. Interestingly enough, perception E (Minimize downtime) is next in line – if you don’t have a plan to minimize the downtime, don’t even attempt to start the migration.
Now, these two are contradicting perceptions, so how do we resolve the contradiction? This is a perfect case for another tool – 40 Inventive Principles. The Inventive Principles tool can help you in breaking a contradiction and come up with an innovative solution. That is a discussion for a separate article. Many blog posts are available in this category with explanations and case studies.
Conclusion
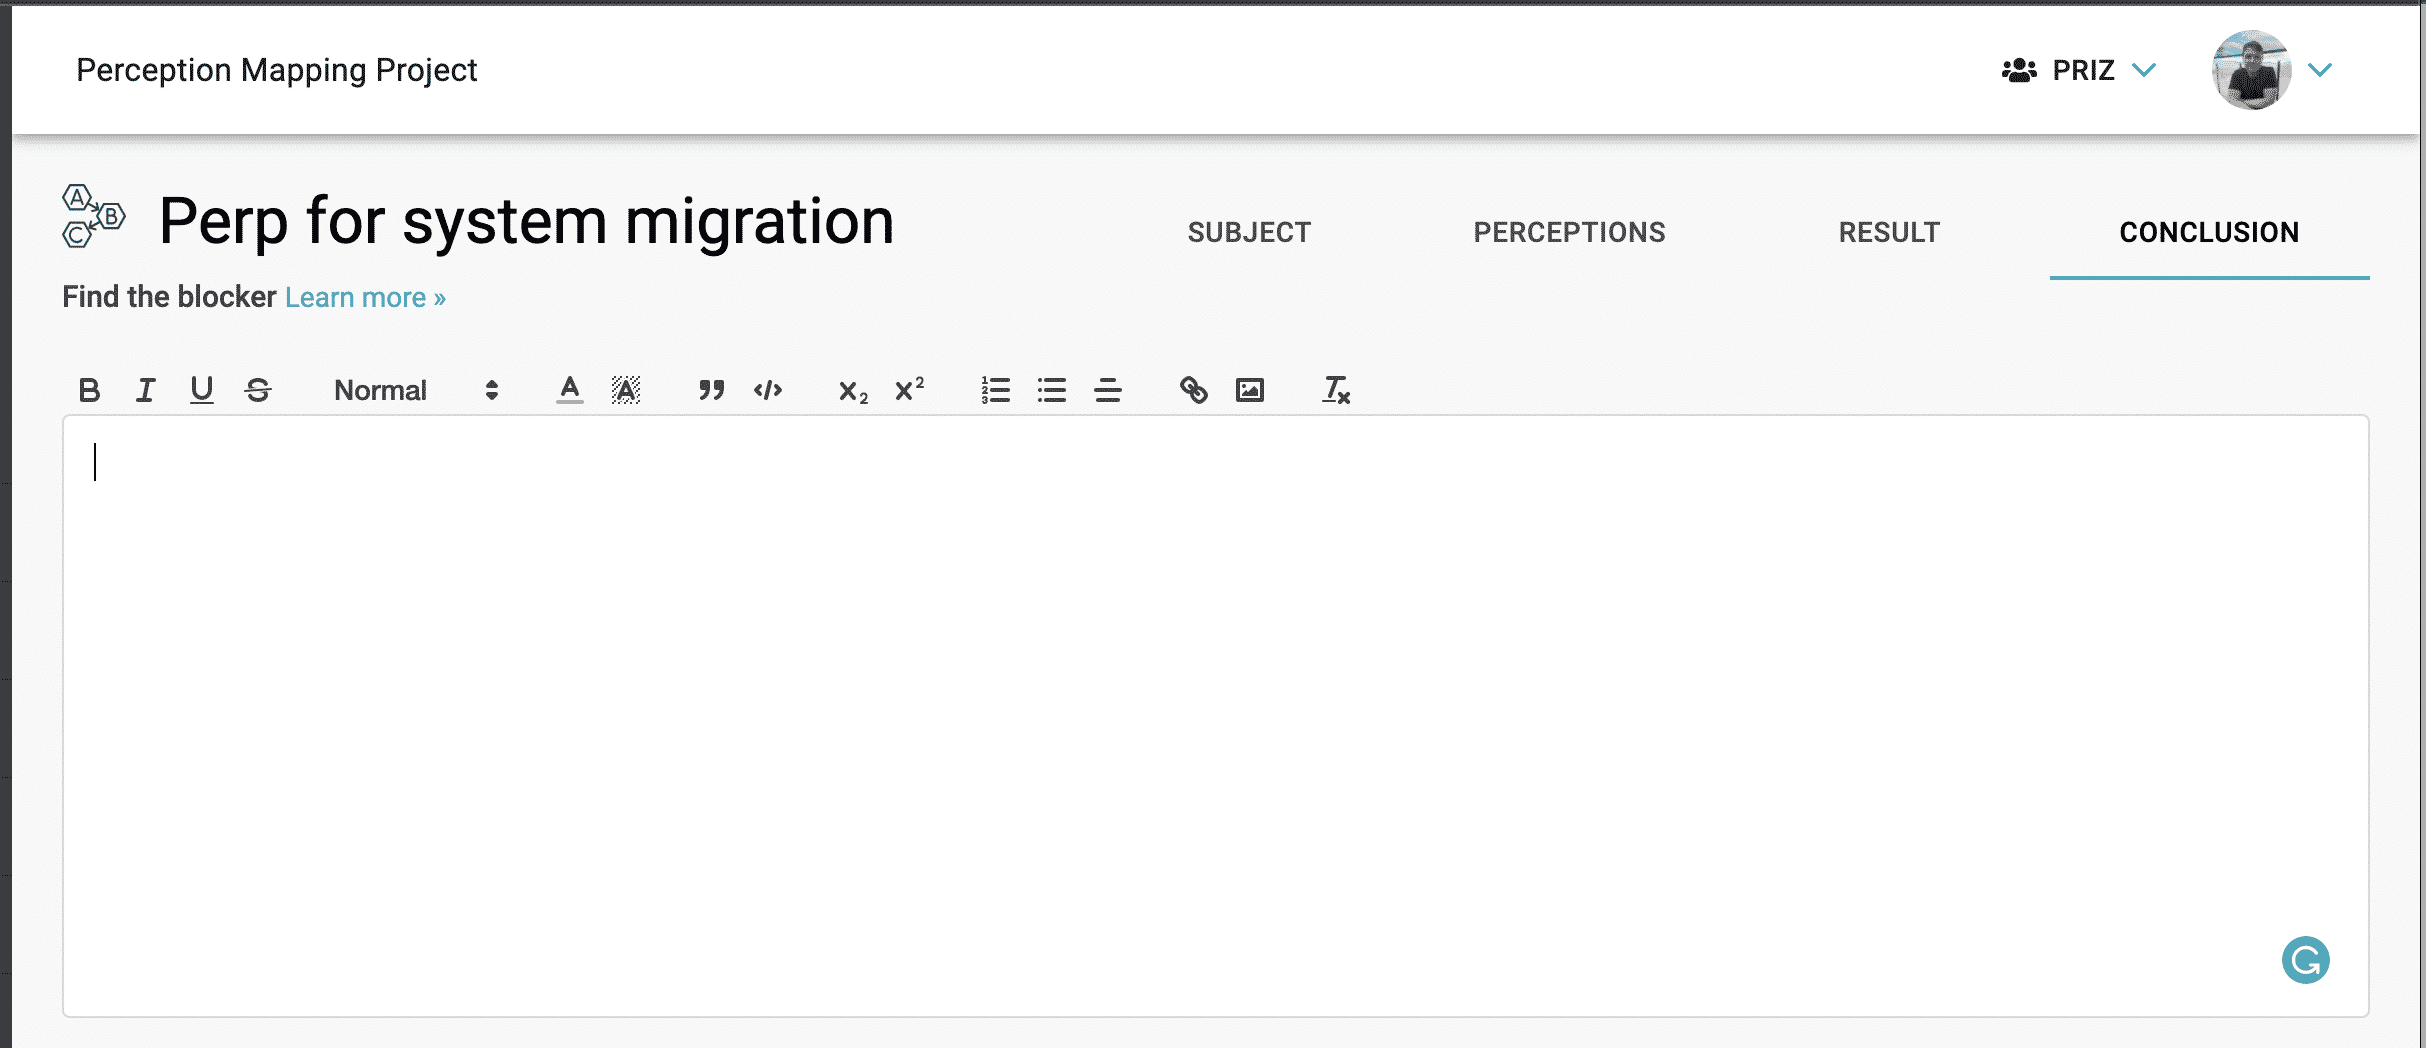
The conclusion tab is the place where you can document any conclusions that you have as a result of perception mapping analysis. This is a free format rich text editor. Similar to the subject, you are welcome to have any information you feel is useful for you, your team, and your leadership. The conclusion will also be included in the final report with anything else related to your work with this tool.
Tool controls & final notes
Like any other tool, perception mapping also has controls at the bottom of the page.

These controls are always visible while you are working on any tool.
Cancel & Delete button allows you to delete one particular use (instance) of a tool, in case you decided that you don’t need it.
Record an Idea button allows you to record an idea at a project level at any point in time. These ideas are collected in ideas manager.
Create New Task button allows you to create a new task without leaving a tool. Just imagine that, while working on a tool, you and your team decided that there is something that you need to do. This is how you would record that task.
Complete button allows you to complete the usage of a tool and lock all the related data. The data will stay available for viewing, but not for editing.
Contact us with any questions.