Every manufacturing improvement introduces a contradiction. Engineering teams must continuously improve yield, reduce costs, shorten cycle times, and increase productivity. Yet the manufacturing processes they modify must remain stable, reliable, and predictable.
Manufacturing must remain stable while constantly changing. A seemingly beneficial change can introduce unexpected interactions, trigger yield excursions, compromise product reliability, or destabilize an established technology.
The challenge is not simply to evaluate whether a proposed improvement will work, but to understand how that improvement could cause a serious failure before it is implemented. This is the purpose of Model-Based Risk Management (MBRM): a structured engineering methodology for identifying potential failure mechanisms, developing prevention strategies, and making informed decisions about process changes.
MBRM complements Model-Based Problem Solving (MBPS):
Both approaches rely on understanding system behavior, interactions, and failure mechanisms. The difference is when that investigation begins.
Most manufacturing process changes are driven by two fundamental objectives:
These parameters form a useful engineering map for understanding the consequences of change. The ideal manufacturing process combines the highest possible yield with the lowest possible cost.
In practice, every process operates somewhere away from this ideal. A proposed change moves the operating point within the Yield–Cost space. A successful change moves the process closer to the ideal. An unsuccessful change moves it farther away.
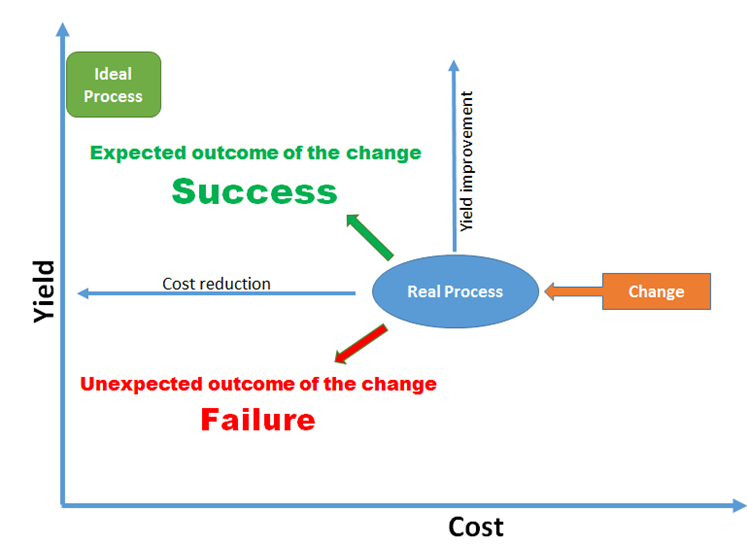
However, yield and cost are not necessarily equal priorities. In yield-sensitive manufacturing, yield is a critical indicator of process health and technological robustness. A reduction in manufacturing cost provides little benefit if the same change introduces unacceptable yield loss. What initially appears to be a cost-saving measure can become a much larger economic problem through scrap, rework, lost capacity, reliability issues, or delayed deliveries.
For this reason, MBRM treats potential yield degradation as a serious failure scenario that must be investigated before a change is approved. A process change should improve the manufacturing system without compromising its stability.
Consider a simple real-life situation. A young couple arrives at a snowy hill with their baby and a sled. The slope appears gentle and safe. The father releases the sled near the top, and the mother waits at the bottom to catch it.
Everything works perfectly, until something unexpected happens. The mother’s leg sinks into deep snow. She cannot move quickly enough, and the sled continues accelerating downhill.
Fortunately, nothing terrible happens. But what appeared to be a harmless activity suddenly becomes dangerous. What was the mistake? The parents assessed the situation as low risk.
They evaluated what they expected to happen: a gentle slope, a manageable speed, and someone ready to catch the sled. They did not sufficiently examine what could happen if one of those conditions failed. This is a common weakness in engineering risk assessment.
When a proposed change is classified as low risk, the assessment can become a reason to stop investigating. Engineers may overlook additional failure mechanisms because the situation already appears acceptable. But an apparently low-risk situation may simply contain failure mechanisms that have not yet been recognized.
The real engineering question is therefore: What could turn this seemingly safe change into a serious failure?
Risk assessment traditionally attempts to answer these three questions:
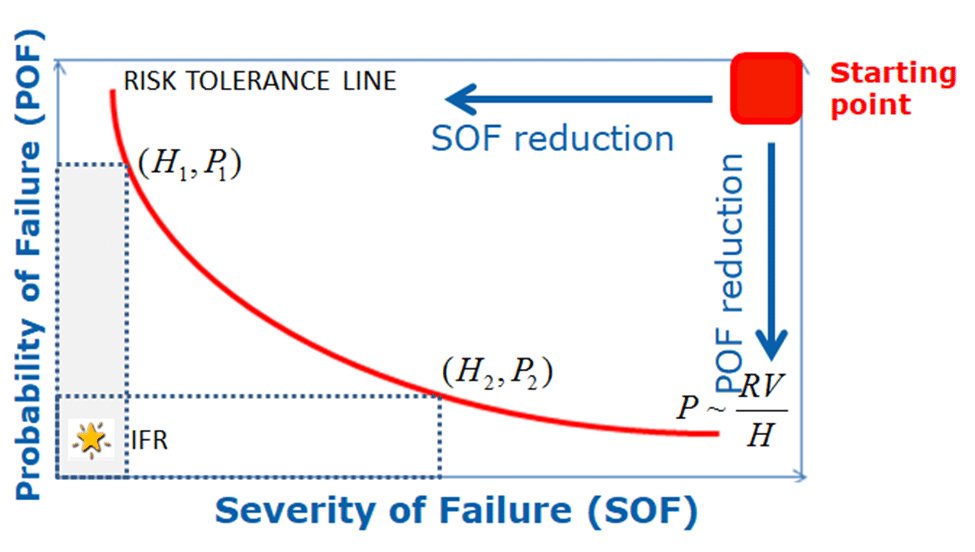
Two parameters are central to MBRM. Severity of Failure (SOF) describes the consequences if a failure occurs. Probability of Failure (POF) describes the likelihood of that failure occurring.
A potentially catastrophic event with a low estimated probability may still deserve substantial attention. Likewise, an event that appears manageable can become dangerous when an important condition or safeguard is overlooked.
The ideal condition corresponds to the Ideal Final Result (IFR):
This represents an aspirational condition in which failure does not occur and causes no harm. Real engineering systems operate under uncertainty. Not every interaction is completely understood, and not every possible failure mechanism has been identified.
The challenge is that human judgment is not always objective. When the expected benefits of a change are attractive, engineers and decision-makers may unintentionally underestimate its risks. A favorable risk assessment can reflect incomplete knowledge rather than genuine safety. MBRM addresses this problem by deliberately changing the starting assumption.
In Greek mythology, Cassandra predicted the destruction of Troy, but no one believed her warnings. Her story provides a useful principle for engineering risk assessment. When evaluating a proposed change, engineers must be willing to imagine a disastrous outcome, even when everyone expects the improvement to succeed.
Instead of asking:
What if the change works?
MBRM asks:
How could this change destroy the system?
This leads to the first fundamental rule of Model-Based Risk Management:
Every proposed change must initially be treated as HIGH RISK.
This is a deliberate analytical assumption, not a conclusion that every change is inherently dangerous. The objective is to overcome the psychological tendency to focus on expected benefits while overlooking potential failures. Starting with HIGH risk forces the team to investigate possible failure mechanisms before reducing its assessment of the risk. It encourages engineers to challenge assumptions, examine interactions, and identify conditions under which a proposed improvement could produce an unacceptable outcome.
The goal is not to predict catastrophe with certainty. It is to understand how catastrophe could happen and what would prevent it.
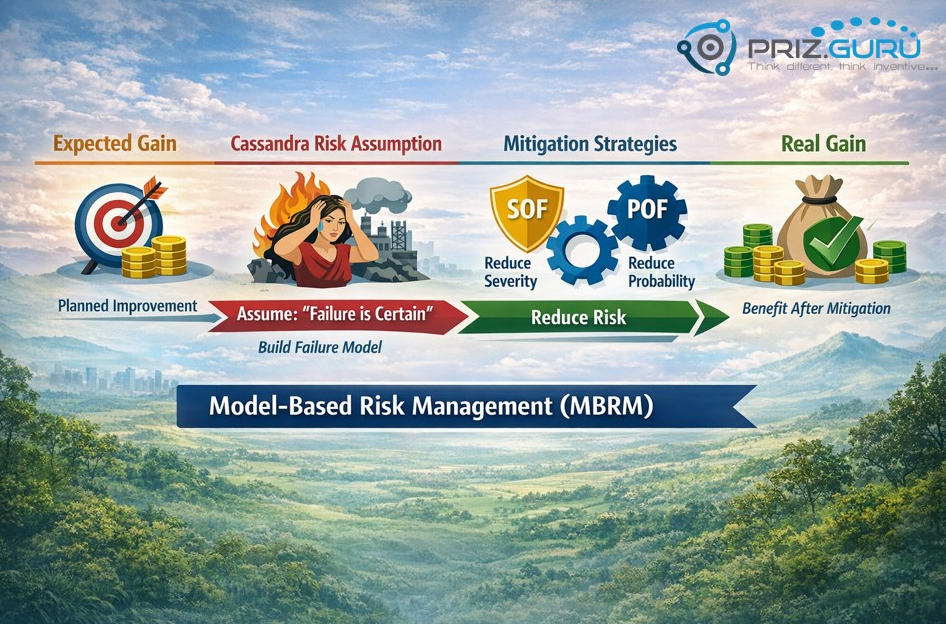
MBRM organizes this reasoning into four steps. Each step builds on the previous one, moving from the proposed improvement to a model of potential failure, a prevention strategy, and a final implementation decision.
Every engineering change begins with an expected improvement. Before evaluating the risks, the proposed change must be clearly described. Four questions establish the starting point:
The expected gain may include lower manufacturing costs, higher yield, reduced cycle time, or improved productivity. This stage often requires inventive thinking. Engineers explore new approaches, alternative processes, equipment modifications, or other ways to improve the existing system.
But the attractiveness of a solution must not determine its risk rating. Regardless of how promising the change appears, the initial risk is assigned as HIGH. This establishes the mindset required for the next step. If there is any doubt, remember Cassandra.
This is the most important analytical step in MBRM. Engineers deliberately assume that the proposed change could lead to a catastrophic or otherwise unacceptable failure. The challenge is then reversed. Instead of proving that the change will succeed, the team must construct a credible model explaining how the change could cause a severe failure.
This requires examining the manufacturing system and its interactions. Which components or process steps could be affected? Which interactions might change? What sequence of events could produce a failure? What resources or operating conditions might enable it?
Several structured engineering methods can support this investigation:
Together, these methods help engineers build an explicit representation of potential failure mechanisms. The analysis may reveal harmful interactions that were not apparent during the initial evaluation of the proposed change. It may also identify missing evidence, untested assumptions, or conditions that require further investigation.
Importantly, the model is a structured hypothesis about possible failure, not proof that the failure will occur. The proposed change should not proceed until credible severe-failure mechanisms have been sufficiently understood and addressed. The quality of this model determines how effectively the team can develop prevention strategies.
Once a potential failure mechanism has been identified and understood, the next task is to reduce the associated risk. MBRM requires engineers to investigate two distinct directions. Both are important, but they address different aspects of the problem.
The tactical approach: minimize the consequences if failure occurs. Assume that the failure still happens. How can its impact be limited?
Potential measures include additional monitoring, early detection with a defined response, containment mechanisms, protective systems, and other safeguards. For example, a manufacturing process might be monitored for early indications of an abnormal condition so that corrective action can be initiated before the failure propagates.
The underlying mechanism may still exist, but its consequences can be reduced. This is a tactical approach because it focuses on controlling the damage associated with failure.
The strategic approach: prevent the failure from occurring. This direction addresses the failure mechanism itself. What must change in the system to make the failure less likely?
Possible measures include design modifications, process redesign, equipment improvements, or the elimination of conditions required for the failure to occur. Rather than relying primarily on detection and response, this approach seeks to reduce the probability that the harmful event will develop.
The distinction is fundamental. One direction limits the consequences. The other targets the conditions that produce the failure.
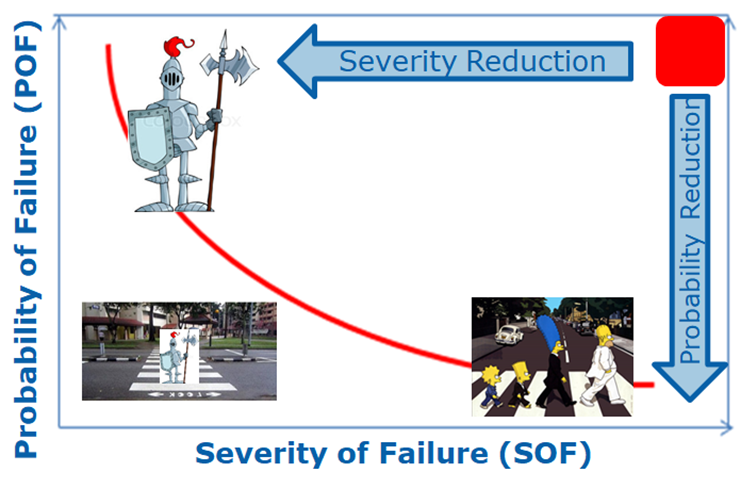
A central rule of MBRM is:
Severity reduction and probability reduction must be analyzed separately.
Combining both directions too early can obscure the actual failure mechanisms and make the analysis less reliable. When several factors are changed simultaneously, engineers may struggle to determine which measure reduces the likelihood of failure and which limits its consequences.
Separate analysis preserves clarity. It allows teams to understand the purpose and effectiveness of each proposed measure before combining them into a broader prevention and mitigation strategy.
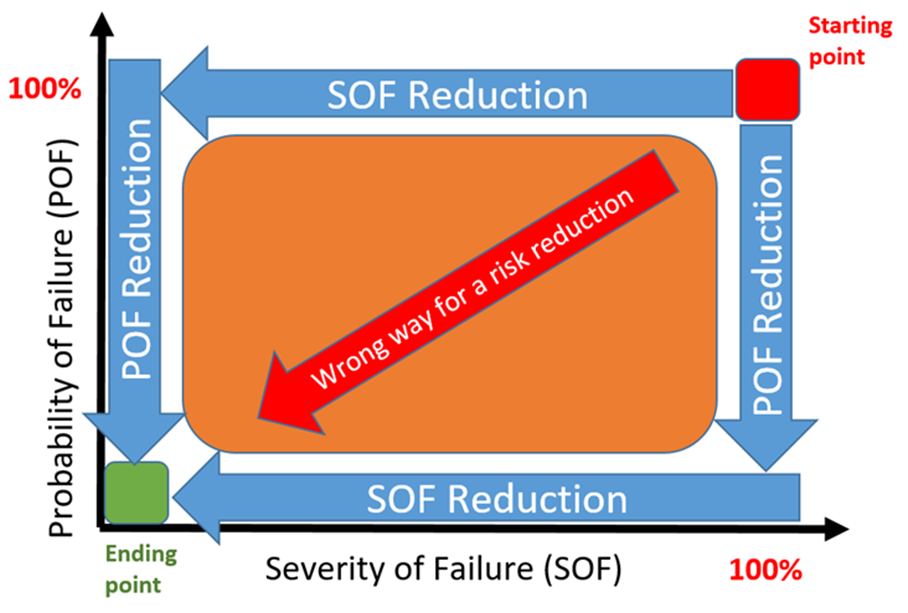
The final implementation plan may include both tactical and strategic measures. The important point is that each measure should address an understood aspect of the failure scenario.
A proposed change may offer an attractive improvement in yield, cost, or productivity. But preventing or mitigating its potential failures requires resources. Additional monitoring, equipment modifications, engineering work, qualification testing, and process redesign all consume time and money.
Failure prevention and mitigation have a cost. Therefore, the original expected gain is not necessarily the real economic benefit of implementing the change. At its simplest:
Expected net gain = Expected gain − Prevention and mitigation cost
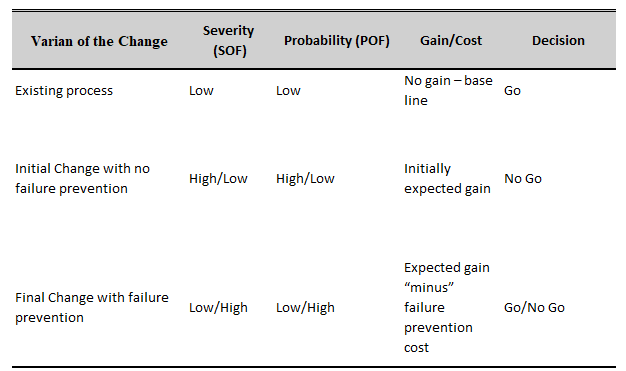
The decision must consider whether the improvement remains worthwhile after the necessary protective measures are included. Sometimes the analysis reveals that preventing potential failures requires investments that eliminate the expected economic benefit.
In other situations, a serious risk cannot be reduced to an acceptable level. In such cases, the correct engineering decision may be not to implement the change.
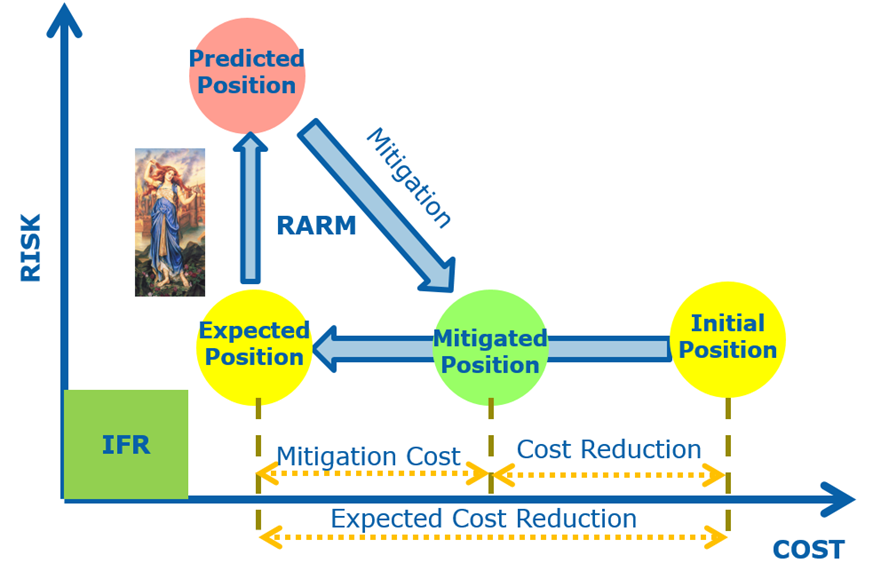
A Go decision requires a sufficiently understood failure model, an appropriate risk-control strategy, and a justified economic benefit. A No-Go decision is appropriate when the remaining risk is unacceptable or the cost of the necessary controls outweighs the expected improvement. A technically possible change is not always a worthwhile change.
The four steps of MBRM address more than technical risk. They also address how engineers and organizations think.
When a team develops a promising improvement, attention naturally concentrates on the expected benefit. The proposed solution becomes attractive. The business case appears convincing. Engineers may have already invested significant effort in developing the approach.
This creates psychological inertia: the team becomes more inclined to search for evidence that supports the change than to examine conditions under which it could fail. Traditional risk assessment can reinforce this tendency when an early classification of “low risk” reduces the motivation for further investigation.
MBRM deliberately challenges that pattern. The Cassandra principle asks engineers to formulate the inverse problem:
How could the desired improvement cause a catastrophic failure?
This question redirects attention toward harmful interactions, hidden dependencies, and assumptions that might otherwise remain unexplored. The investigation then progresses from imagined failure to a technically reasoned failure model. That model becomes the basis for evaluating preventive and mitigating actions. The result is a more disciplined engineering decision.
Model-Based Risk Management provides a systematic way to evaluate the consequences of change before those consequences appear in production. It can be applied to a wide range of manufacturing activities, including yield-improvement initiatives, defect reduction, cycle-time optimization, cost-reduction projects, and equipment or process modifications. The methodology helps engineering teams:
Structured analytical tools available in PRIZ Guru, including Functional Modeling, Cause–Effect Chain Analysis, and Process Functional Modeling, help organize the engineering reasoning involved. The value comes from the methodology and the quality of the engineering analysis. Software supports that work; it does not automatically discover or eliminate every potential failure.
Manufacturing organizations cannot stop changing. Continuous improvement is essential to competitiveness, productivity, quality, and profitability. But improvement must be accompanied by a disciplined understanding of the risks it introduces.
Model-Based Risk Management establishes a practical engineering sequence:
Define the improvement. Assume HIGH risk. Model the potential failure. Develop prevention and mitigation strategies. Evaluate the real gain. Make the Go/No-Go decision.
The central principle is simple: Do not wait for a process change to reveal its failure mechanisms in production. Investigate those mechanisms before making the change.
That is how engineering teams can pursue improvement while maintaining better control over manufacturing stability, yield, and risk.