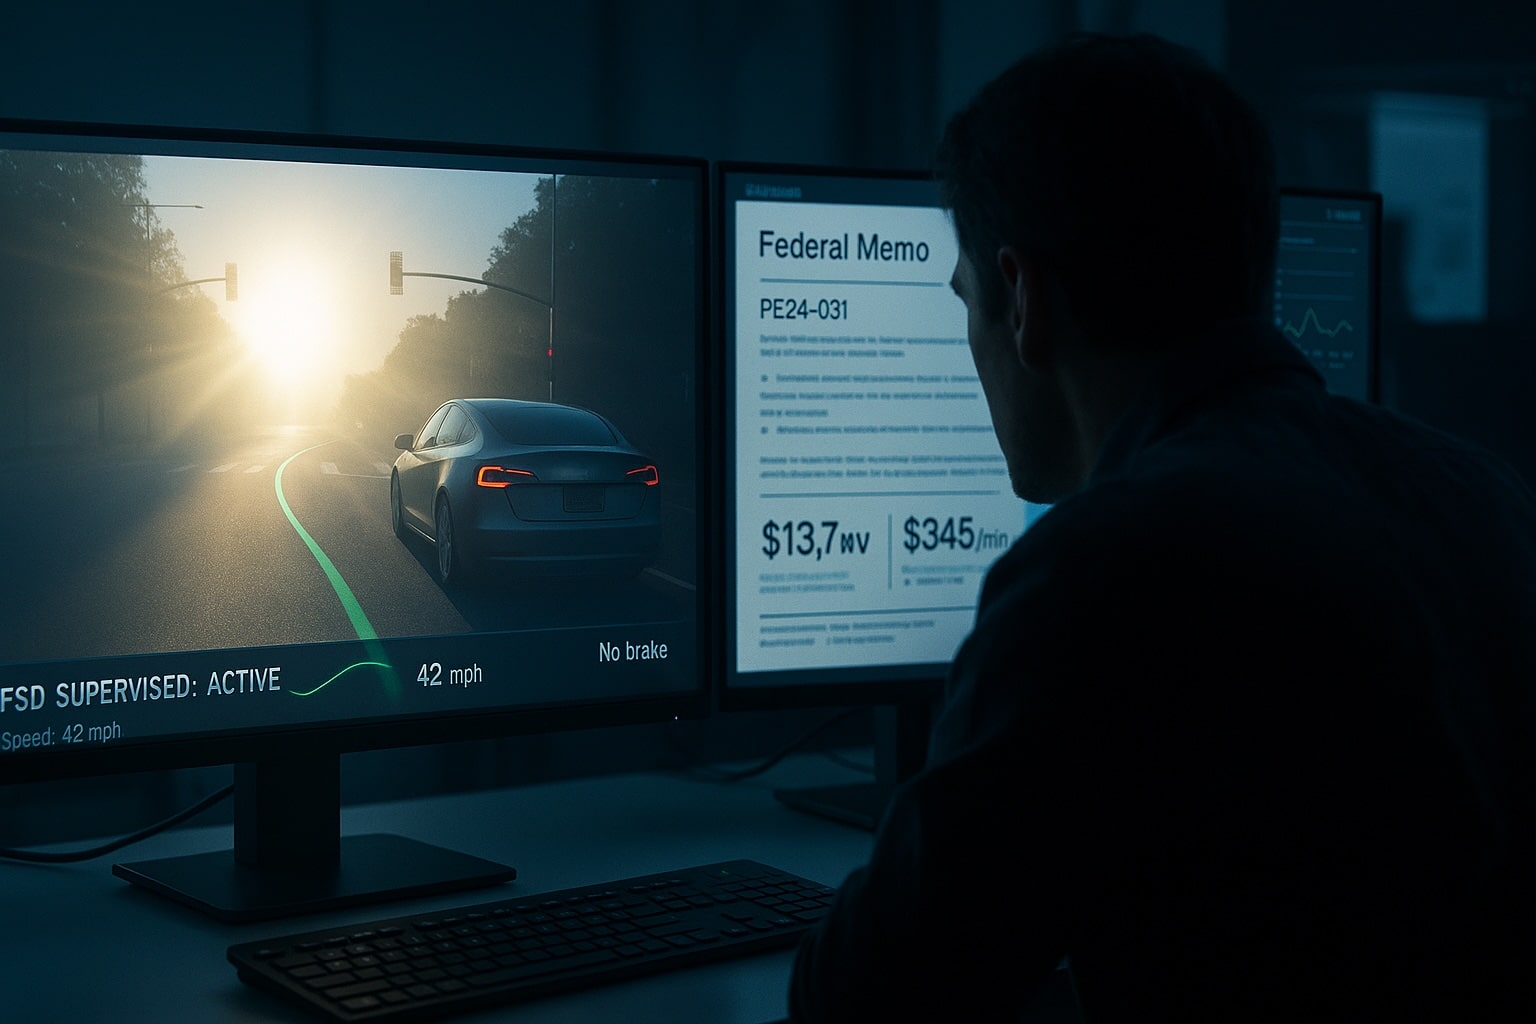
It’s 5:42 a.m. in the lab, and the air feels thick with urgency. A paused dash-cam frame dominates one wall-mounted screen: a suburban street bathed in the harsh glow of early morning sun, everything haloed in blinding light. The car’s projected path line arcs smoothly ahead, unperturbed. The driver’s hands are relaxed, off the wheel. Up ahead, the traffic signal has just flipped to red, but the telemetry data shows no braking input. Full Self-Driving (FSD) Supervised is active, confidently navigating what it perceives as a clear path.
On the adjacent monitor, an incident report from the recent weekend scrolls into view. Conditions: reduced visibility due to sun glare on wet asphalt. The sequence unfolds in stark brevity: enter intersection, detect conflict too late, impact. The critical line jumps out: “Pedestrian fatality”. A fresh federal memo from the National Highway Traffic Safety Administration (NHTSA) has just arrived via email, announcing a formal examination of a troubling pattern in Tesla crashes involving FSD in low-visibility scenarios like sun glare, fog, or airborne dust. The memo is matter-of-fact about the fatality, one of four collisions under review in the probe known as PE24-031, initiated on October 17, 2024.
Fast-forward to October 2025, and a second investigation launches (PE25-012), targeting alleged traffic-law violations with FSD engaged: running red lights, veering into oncoming lanes, crossing double-yellow lines. This one casts a wider net, potentially affecting nearly 2.9 million vehicles. In the quiet of the lab, the team absorbs the implications. They know the math all too well: the U.S. Department of Transportation (DOT) pegs the value of a statistical life (VSL) at $13.7 million in 2024 guidance, a benchmark for assessing the economic toll of fatalities. Add to that roughly $345 per minute in congestion costs during incident response – lanes blocked, traffic snarled, public frustration mounting.
The lab director leans forward, breaking the silence with a pointed question: “When vision loses its margin for error, does the system have the right to keep going?” It’s a query that echoes through boardrooms and regulatory halls, as the promise of AI-driven autonomy collides with the unforgiving realities of the road.
The challenges facing systems like Tesla’s FSD aren’t isolated flukes; they’re symptomatic of deeper, recurring patterns in the development and deployment of advanced driver-assistance systems (ADAS). Drawing from NHTSA investigations, NTSB crash analyses, and industry standards, we can distill these into four key issues.
FSD and similar technologies often excel in controlled demonstrations or optimal conditions – clear skies, well-marked roads, predictable traffic. However, their safety envelope in real-world messiness, such as sun glare saturating cameras or fog scattering lidar signals (if equipped), lacks a fully proven assurance case. The NHTSA’s 2024 memo on PE24-031 is explicit: it targets a cluster of scenarios where reduced visibility led to crashes, including one fatal pedestrian strike. This highlights a gap where the system’s “vision-only” approach, reliant on neural networks trained on vast datasets, may falter when environmental noise overwhelms input data.
In the 2025 probe (PE25-012), NHTSA catalogs incidents where FSD allegedly ignores red lights, drifts into opposing lanes, or executes improper turn behaviors that appear seamless until they violate traffic norms. With approximately 2,882,566 vehicles under scrutiny, this pattern suggests unclear decision boundaries: when does the AI yield to human judgment? Reports include 58 incidents, with 14 crashes and 23 injuries, underscoring how smooth automation can mask risky overconfidence.
Historical findings from the National Transportation Safety Board (NTSB) repeatedly flag ineffective monitoring as a contributor to complacency in partial automation systems. In a 2018 Tesla crash investigation (HWY18FH011), the NTSB noted that torque-based monitoring, sensing light wheel touches, failed to ensure true engagement, allowing distractions like phone use. This persists as a precursor to incidents, where drivers, lulled by the system’s competence in routine tasks, disengage mentally until it’s too late.
Aviation software undergoes rigorous certification via standards like DO-178C/ED-12C from the Federal Aviation Administration (FAA), ensuring traceable safety from design to deployment. In contrast, automotive ADAS blends ISO 26262 (focusing on malfunctions in electrical/electronic systems) with Safety of the Intended Functionality (SOTIF, ISO/PAS 21448), which addresses risks when the system functions as designed but inadequately in foreseeable conditions. Degraded perception in glare or fog falls squarely under SOTIF, yet many deployments lack comprehensive coverage for these non-failure hazards.
These patterns аре backed by real-world data from NHTSA’s Office of Defects Investigation (ODI) and echoed in media coverage from outlets like The Washington Post, which detailed flaws in Tesla’s systems as early as 2023, with updates on the 2024 and 2025 probes.
Autonomy is often pitched as a multiplier for growth, unlocking robotaxis, reducing human error, and boosting efficiency. But the profit-and-loss ledger tells a harsher story when edge cases go unaddressed, turning innovation into liability.
In aggregate, these costs create a “hidden tax” on autonomy, where short-term deployment gains yield long-term setbacks.
Fixing this isn’t about a quick software tweak or a defensive press release; it’s about instilling a culture of safety with the rigor of high-stakes fields like aviation or medicine. The goal: a model-first safety case that anticipates hazards and enforces boundaries.
Key changes include:
These shifts transform reactive firefighting into proactive governance, aligning AI’s potential with ethical imperatives.
To quantify the impact, consider a 12-week implementation window. Representative targets, aligned with internal baselines and safety gating, show tangible improvements:
| Metric | Before | After | Improvement Notes |
|---|---|---|---|
| Time-to-Root-Cause (hours) | 36 | 12 | Achieved via hazard-tagged event streams for faster analysis. |
| Change-Failure Rate (%) | 9.8 | 3.5 | Releases gated by comprehensive safety evidence reduce rollbacks. |
| Intersection Violations per 10k FSD Miles | 1.2 | 0.4 | Enhanced SOTIF coverage and disengage logic minimize errors. |
These KPIs are derived from standards like ISO 26262 and real-world telemetry, ensuring measurable accountability.
Implementing change requires actionable steps. Here’s a distilled playbook, with micro-examples grounded in regulatory contexts.
Consider a real-world analog: a crossover electric vehicle (EV) program rolled out city streets automation with robust lane-keeping but fragile intersection handling under glare. Post a near-miss (no injuries), leadership convened a Safety Envelope Tiger Team, dividing efforts into perception, controls, and driver-state.
Within 12 weeks, they instituted a ritual: no software exits development without evidence for the top-five hazards, validated through synthetics, tracks, and field replays. A summarized assurance case, informed by FAA-style traceability and SOTIF protocols, was shared with regulators.
The results? A snippet of before/after metrics:
| Metric | Before | After |
|---|---|---|
| Intersection Violations / 10k Miles | 1.0 | 0.35 |
| Edge-Case Time-to-Root-Cause (hours) | 30 | 11 |
| Release Slippages per Quarter | 3 | 1 |
Fewer emergency rollbacks meant a more predictable cadence, turning potential crises into controlled progress.
No need to wait for the next probe; seize the moment with these immediate moves:
As autonomy evolves, these practices ensure AI serves safety, not vice versa.