It started the way these problems always start: with a number that’s too big to ignore.
At 9:12 AM on a Monday, the supervisor on Line 3 walked into the quality area holding a printout from the final leak tester. The scrap rate wasn’t drifting upward. It had jumped. The line had been running normally over the weekend, shipments were queued, and now 6.8% of assemblies were failing a leak test that usually rejected less than 1%.
This is the moment when teams either do a real root cause analysis, or they do a meeting.
So the plant did the only sensible thing first: containment. Then they did something that most factories say they do (but often don’t): they treated the investigation as a structured logic problem, not a brainstorming contest.
What follows is a narrative manufacturing defect RCA case study showing how a cross-functional team combined 5 Whys with a Cause & Effect Chain to get to a root cause they could prove, fix, and prevent from returning.
A useful RCA is built around a simple promise: identify underlying causes and implement corrective actions that prevent recurrence, not just treat symptoms.
That sounds obvious until the pressure hits. When you’re staring at missed shipments and overtime, it’s very tempting to accept the first explanation that feels actionable: “Operator mistake.” “Bad parts.” “Test station is flaky”. Everyone can move forward, right up until the same failure returns next week.
This team decided to do it differently. They would move fast, but they wouldn’t move blindly.
The product was a solenoid valve assembly used in industrial equipment. The process was straightforward on paper: O-ring insertion, press-fit, torque, then final automated leak test. The station in question (LT-3) had been stable for months.
But stability is exactly why the spike was alarming. Stable systems don’t suddenly misbehave without a reason.
The team opened a new investigation in PRIZ Platform, not because “software solves problems”, but because they wanted a shared workspace where the logic, evidence, and decisions wouldn’t scatter across chat threads, whiteboard photos, and half-remembered conversations.
By 9:40 AM, the investigation had a title that captured what mattered:
“Line 3 final leak failures spike after weekend run, possible process or measurement change.”
Not glamorous. Useful.
Before anyone asked “why,” the quality engineer asked a better question: What do we need to do right now to protect the customer, protect shipment integrity, and protect our ability to learn what happened?
They quarantined the last two pallets, separated WIP by time window, and switched to short-interval sampling while the analysis ran. No grand gestures, just enough to prevent escapes and preserve a clean trail back to the moment the spike began.
Containment isn’t the RCA. But it’s what makes the RCA possible.
Most RCAs fail quietly right here. The problem statement gets written like a mood: “Leak test bad.” Or like a solution: “Bad O-rings.” And then the team spends the rest of the day arguing inside a fuzzy box.
This team made it concrete:
This may feel procedural, but it has a purpose: the clearer the “effect,” the cleaner the cause logic can be.
A cause-and-effect diagram is designed to explore and display the possible causes of a specific effect, and to remind teams that there are often many contributors, not one magical culprit.
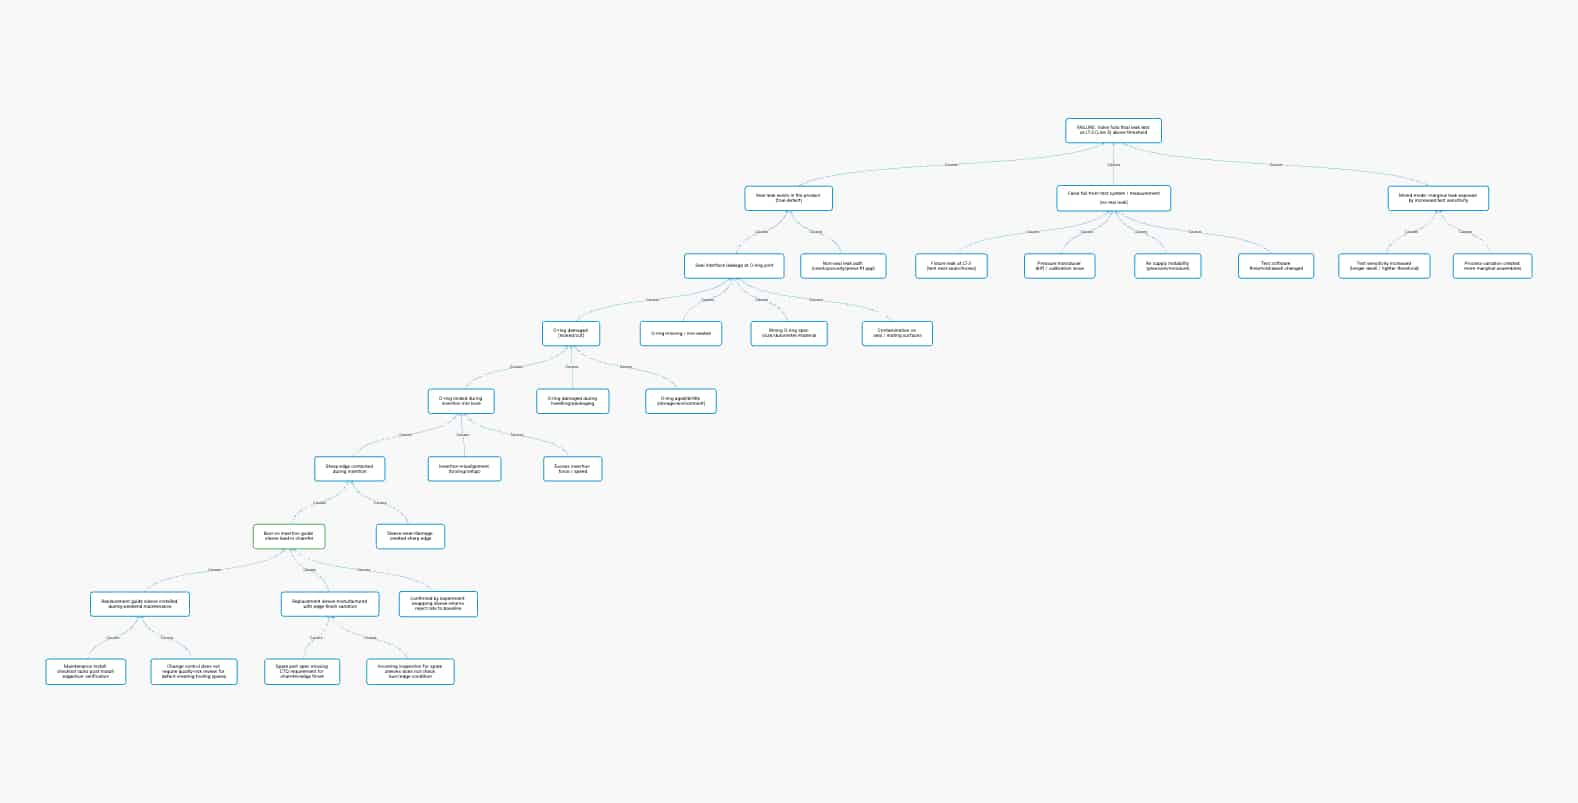
Instead of jumping straight into 5 Whys (which can become a single narrow tunnel), the team first mapped a Cause & Effect Chain in PRIZ Guru: a branching, evidence-driven view of how different causal paths could plausibly lead to “fails leak test”.
They started with the effect at the top:
E0: Valve fails leak test at LT-3
Then they asked, “What big buckets could produce this effect?” Three branches emerged quickly:
This moment matters. It prevents the classic trap: treating the first plausible story as the truth.
Now the team needed to answer a practical question: What kind of failure is this?
If the leak was real, they should be able to see a consistent failure signature and perhaps physical evidence. If it was measurement error, retests might vary, or the tester logs might show drift.
They pulled station logs and re-test results. Patterns appeared:
Now the chain had traction. The branch “real leak exists → seal compromised” wasn’t just speculation; it had a footprint.
The 5 Whys method is the practice of repeatedly asking “why” to move beyond symptoms and discover root cause without obsessing over the number five.
But 5 Whys has a weakness: if you start it too early, you can “why” your way into a story that sounds logical and still be wrong.
This team used 5 Whys the way it works best: after the Cause & Effect Chain had narrowed the search to the most evidence-backed path.
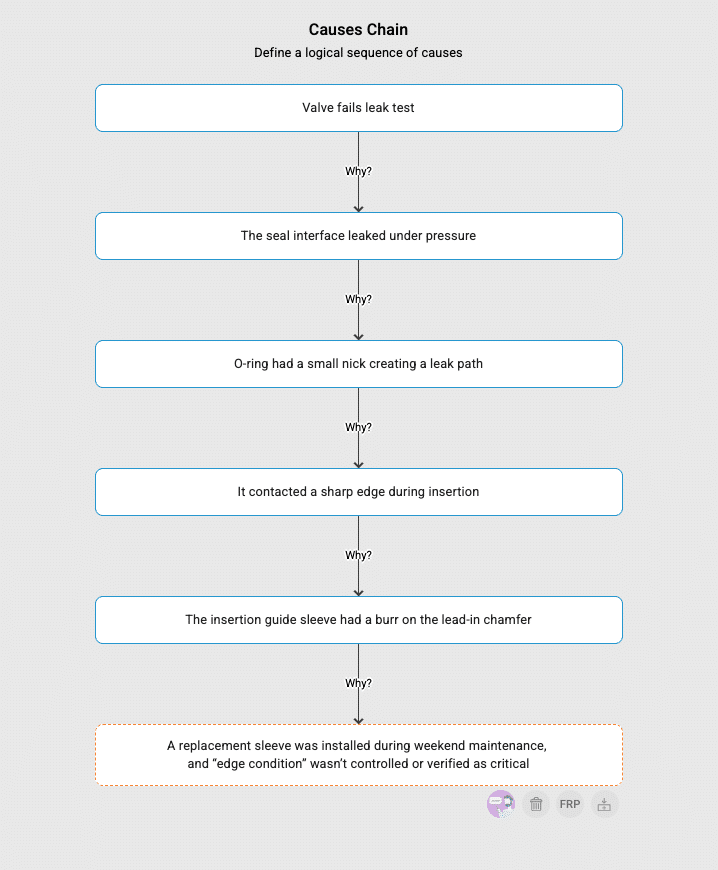
They focused on: Seal compromised → O-ring damaged during insertion
The questions weren’t philosophical, but rather mechanical.
Why did the valve fail leak test? Because the seal interface leaked under pressure.
Why did it leak? Because the O-ring had a small nick creating a leak path.
Why was the O-ring nicked? Because it contacted a sharp edge during insertion.
Why did it contact a sharp edge? Because the insertion guide sleeve had a burr on the lead-in chamfer.
Why did a burr exist (and why wasn’t it caught)? Because a replacement sleeve was installed during weekend maintenance, and “edge condition” wasn’t controlled or verified as critical.
When the last “why” landed, the room got quieter. Because this wasn’t an operator problem. It was a system gap: spare part control + change control + missing CTQ definition.
A good Cause & Effect Chain is a prediction engine.
If the burr on the replacement sleeve was the causal factor, swapping the sleeve should collapse the failure rate – fast.
So they did a controlled check:

Here’s where many teams stop: “Cause was a burr. Fixed by replacing sleeve.”
But if you stop there, you’ve solved today’s incident while leaving tomorrow’s incident intact.
So the team extended the chain beyond the physical defect into the system that allowed it:
This is why cause-and-effect work matters. Fishbone diagrams and cause-and-effect diagrams help teams sort and relate causes; they’re often used to structure brainstorming and deepen causal layers.
But the win comes when you go beyond “what happened” to “what system weakness made it possible,” which is a core aim of RCA practice in multiple industries.
They still replaced the sleeve of course. But the more important changes were the ones that closed the loophole:
They updated the spare part specification so chamfer/edge condition was treated as critical. The team added a simple incoming check for replacement sleeves. They changed the maintenance checklist to include a quick burr verification after installation.
In PRIZ, these actions were linked directly to the verified cause nodes in the chain, so the corrective action list wasn’t a “grab bag of improvements”, but a mapped response to a proven causal mechanism.
And then they did one more thing that separates mature teams from busy teams: they monitored recurrence through the next maintenance cycle. No recurrence, no mystery.
Used alone, 5 Whys can become a straight line that feels satisfying even when it’s incomplete. Used alone, a cause-and-effect diagram can become a crowded brainstorming artifact. But together, they form a practical sequence:
You explore broadly first (because complex systems fail in multiple ways), then you drill deep only after evidence points to the right branch. Exactly what 5 Whys was designed to support.
That’s the core lesson in this root cause analysis example:
The method wasn’t “more documentation”; It was faster truth.
By the end of the day, the plant wasn’t just back at baseline reject rates. They were back to something more valuable: confidence that the line was stable, that shipments were safe, and that the same failure wouldn’t ambush them again the next time a spare part got swapped.
That’s what a manufacturing defect RCA case study should deliver. A story with a tested conclusion and a system that learned.
Because they solve different problems. A Cause & Effect Chain helps you map all plausible paths to the failure (test system, process, materials, setup, environment), so you don’t lock onto one story too early. Then 5 Whys is used inside the evidence-backed branch to drill down to the systemic cause you can actually prevent.
Your cause chain should make a prediction you can test. In this case, the prediction was: “If the burr on the guide sleeve is creating the O-ring damage, swapping the sleeve will immediately drop leak failures.” When the defect rate returns to baseline after the swap (and stays stable through the next maintenance cycle), you’ve moved from a plausible explanation to a verified cause.
Stopping at the first visible cause. “Burr on sleeve” explains the mechanism, but the preventable root cause is the system gap that allowed a burr-prone spare to be installed without checks (spec missing CTQ edge requirement, no incoming verification, no post-install check, weak change-control trigger). Fix the loophole, not just the symptom.