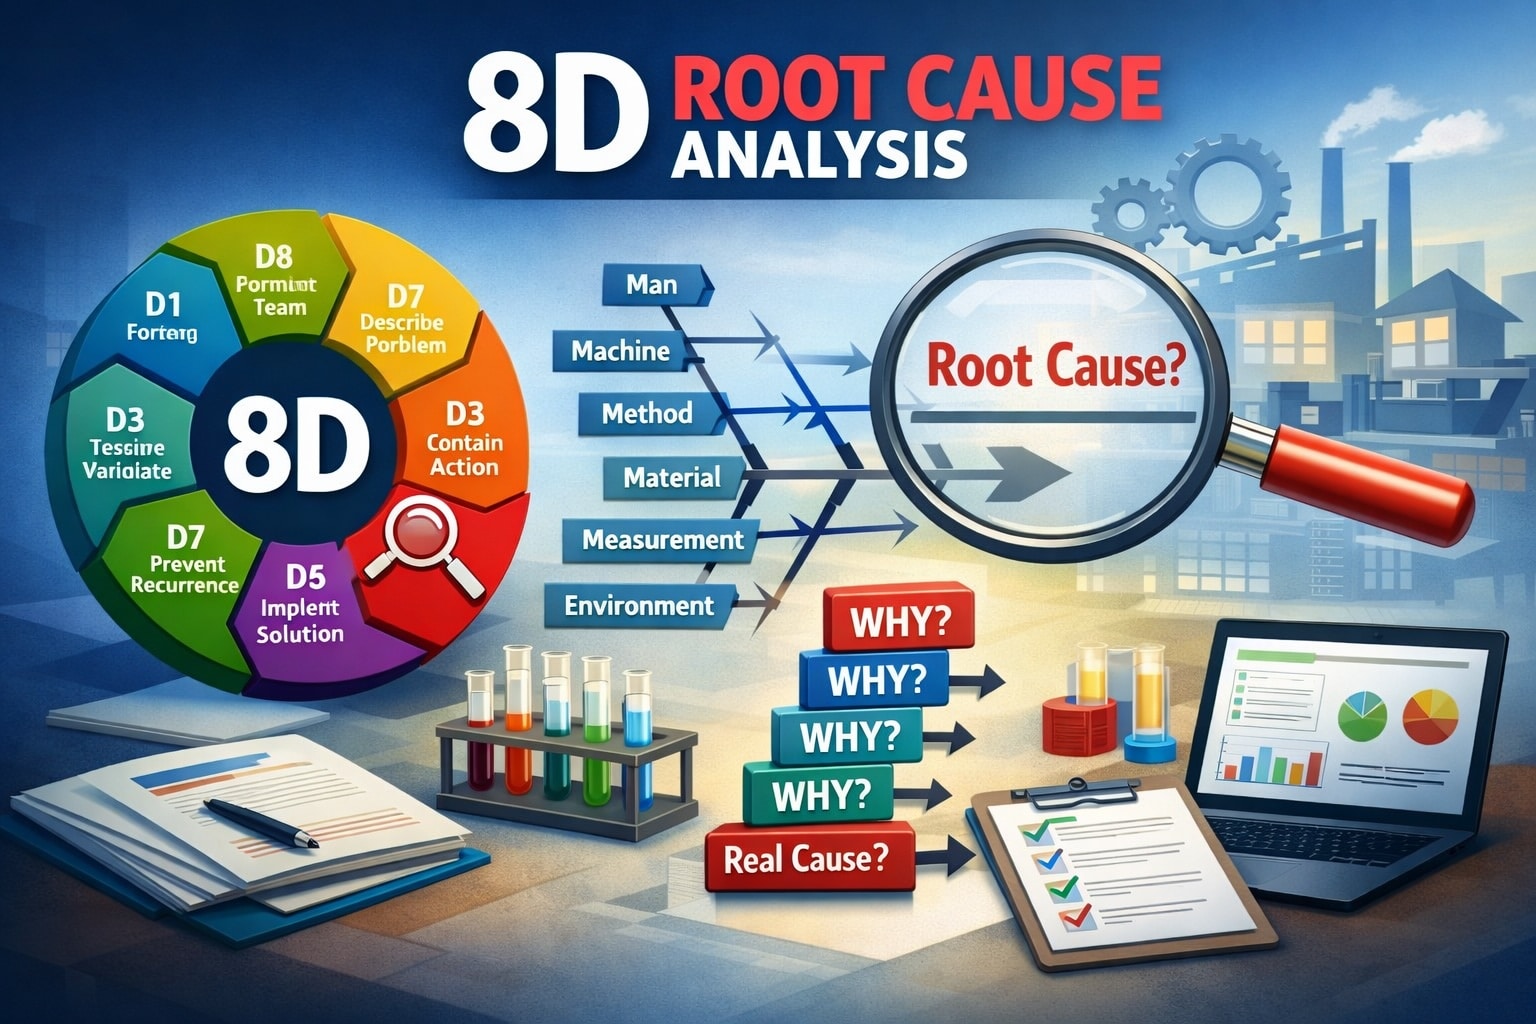
Root cause analysis (RCA) is the practice of digging beneath symptoms to understand why problems occur. In quality management and continuous improvement programs, two visual tools stand out: the Ishikawa fishbone diagram and the cause‑and‑effect chain. Both tools help organize potential causes of a problem and make relationships visible, but they differ in structure, application, and depth. This article compares the traditional fishbone diagram with PRIZ Guru’s cause‑and‑effect chain method, outlines the advantages of each approach, and explains when one might be better suited than the other. We conclude by exploring how PRIZ’s interactive Cause & Effect Chain tool represents the next step in RCA.
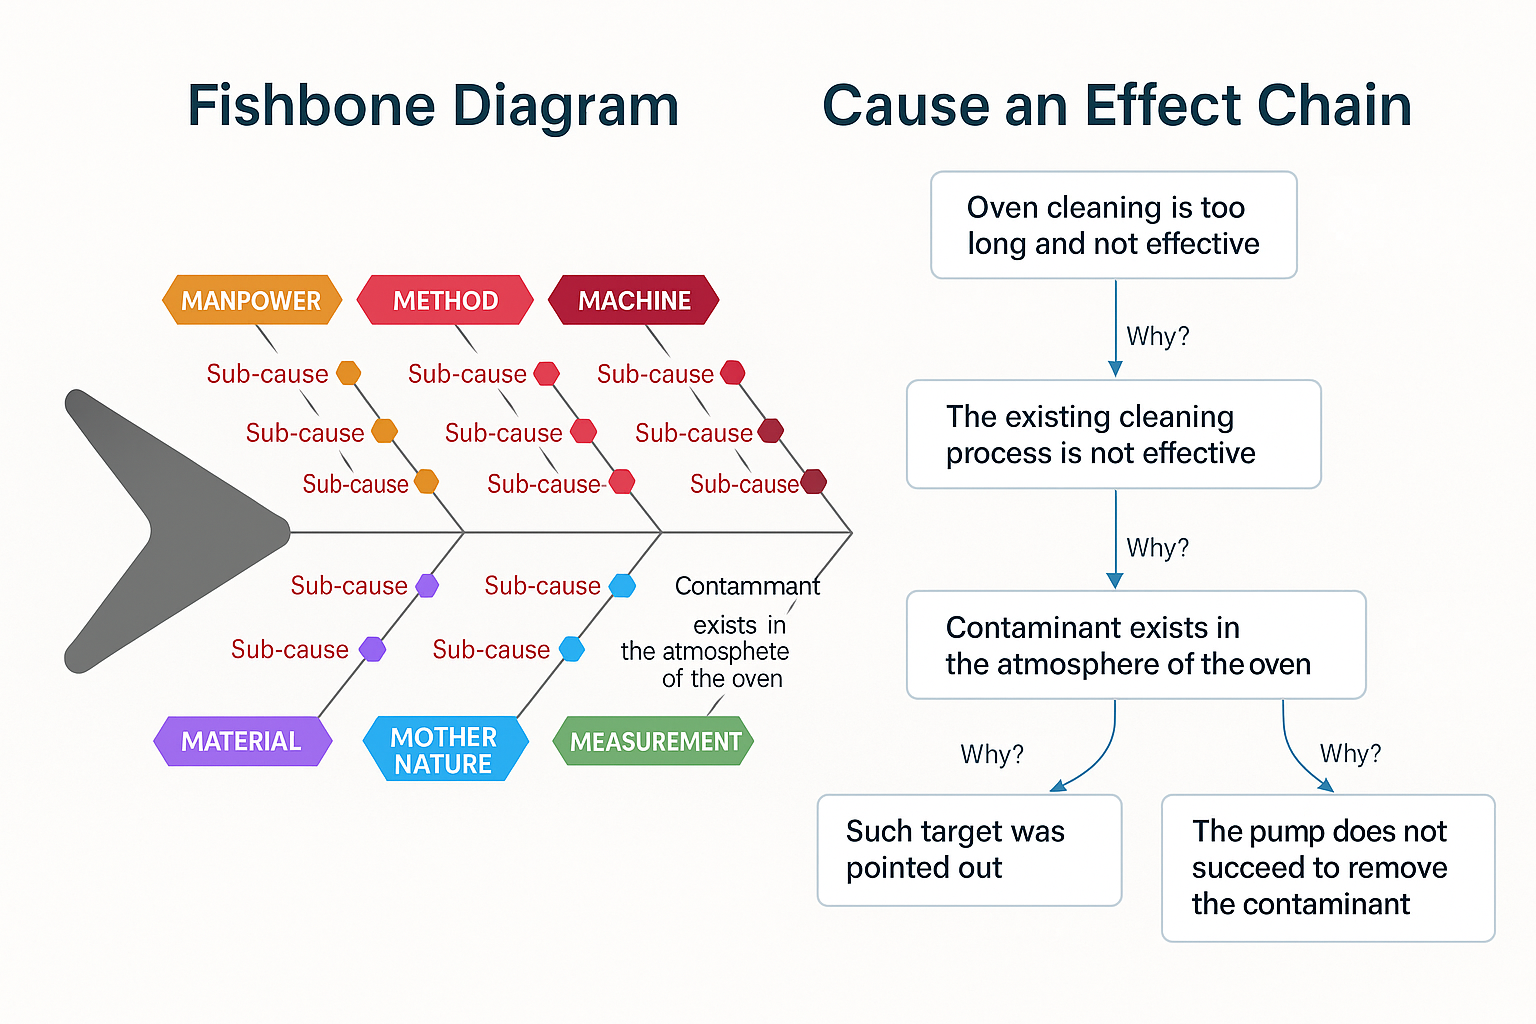
The fishbone diagram, also called the Ishikawa diagram, was popularized by Professor Kaoru Ishikawa in the 1960s. It has become one of the seven basic quality tools and is widely used in Lean Six Sigma, manufacturing, and service industries. The diagram resembles a fish skeleton: a central spine represents the problem or effect, and angled “bones” branch off to represent categories of potential causes. Ishikawa introduced the 6 M categories, materials, machinery, methods, measurement, manpower, and Mother Nature (environment), to encourage broad thinking during brainstorming. Teams write possible causes on the appropriate branch, then ask “why” repeatedly to drill down to more detailed sub‑causes.
The fishbone diagram’s strength lies in its simplicity. Major quality organizations describe it as intuitive and easy to understand. Categorizing possible causes into discrete branches encourages structured brainstorming and prevents teams from overlooking important factors. Because the diagram is built collaboratively, it facilitates joint brainstorming and broad thinking and helps teams drill down toward root causes by repeatedly asking “why”. The process is also flexible; categories can be adjusted or renamed to suit a particular business context.
Despite its usefulness, the fishbone diagram has limitations. Its simplicity can be a drawback; the diagram does not indicate the magnitude or likelihood of each cause, which can make prioritization difficult. Much of the input is based on team members’ opinions, so the interpretation is subjective, and disagreements can arise. Complex problems can produce messy diagrams with many branches, making the visualization hard to read. Brainstorming sometimes yields irrelevant causes, which may consume time and distract from more likely explanations. Finally, because fishbone diagrams are static once drawn, updating them requires redrawing the diagram – a potential obstacle in dynamic projects.
A cause‑and‑effect chain is a reasoning system that shows how one event leads to another, linking causes and effects through a sequence of relationships. At PRIZ Guru, we formalize this approach into an interactive Cause & Effect Chain (CEC) tree diagram. The CEC tool functions as a dynamic brainstorming platform: starting from a problem (the root node), users repeatedly ask “Why?” to add causes as branches. Unlike the linear 5+ Whys, the CEC tree supports multiple branches, capturing the fact that complex problems often have several contributing factors. Each node can include a description, notes, or potential solutions, and nodes are colour‑coded to aid visualization. The tool supports collaboration. Team members can add causes in real time and share knowledge to uncover relationships they might otherwise overlook.
Cause‑and‑effect chains go beyond simple categorization. By mapping how events influence one another, the CEC tool helps users gain a deeper understanding of how a system works and identify the components or processes that impact each other. It forces problem‑solvers to address one cause at a time, which organizes and focuses the thinking. The branching structure makes it easy to quickly eliminate unlikely causes while retaining visibility of complex interdependencies. PRIZ’s CEC tool also lets teams collaborate in real time, attach notes and potential solutions to nodes, and export diagrams for reporting. Because it is digital and interactive, branches can be rearranged, expanded, or collapsed without redrawing the diagram – an advantage over static fishbone charts.
Cause‑and‑effect chain excels in complex or ambiguous situations where multiple factors interact. CEC is ideal for investigating safety deviations, yield drops, or new product development, where many variables contribute to the outcome. In such scenarios, branching analysis uncovers patterns and dependencies that a categorical fishbone might miss. We also recommend using the CEC when you want to identify dependencies within a system, determine the potential impact of changes, or even understand the actions required to achieve a goal. Because the tool captures both ARPs and FRPs, it helps teams balance short‑term corrective actions with longer‑term innovation. By contrast, linear tools like the 5+ Whys are better suited for straightforward issues with a single causal pathway.
Both the fishbone diagram and the cause‑and‑effect chain have their place in RCA. The fishbone diagram’s structured categories are excellent for initial brainstorming, helping teams ensure they are considering factors across people, processes, materials, machines, measurements, and environment. It is easy to construct and understand, making it a staple of quality training and a quick way to organize ideas. When time is limited and the problem is relatively simple, a fishbone diagram can reveal the likely category of the root cause and focus subsequent investigation.
However, when a problem has multiple interrelated causes or requires deeper exploration, the fishbone’s limitations become apparent. Its static, two‑level structure may oversimplify reality, and a crowded diagram can make analysis less effective. A cause‑and‑effect chain, by contrast, builds a tree of causes that mirrors the complexity of real systems. The branching structure shows not only categories but also the relationships between causes. In situations like exploring why a product’s cost is too high, one branch might follow material costs to supplier issues, while another examines inefficient processes leading to equipment downtime. Because the CEC tool is interactive, teams can update the analysis as new information arises, add evidence or notes, and converge on root causes collaboratively.
The Cause & Effect Chain tool provided by PRIZ Guru represents an evolution of the fishbone concept. Like a fishbone diagram, it starts with a problem and encourages brainstorming; however, it adds interactivity, branching, and collaboration. The tool’s canvas lets users drag from any node to create new causes, automatically organizing them into a tree. Each node has fields for a description, potential solutions, and color coding to visualize different categories or ownership. A subject tab captures contextual information about the system or problem, while a conclusion tab allows teams to document insights and decisions. These features make the CEC tool not merely a diagram but a full problem‑solving workspace.
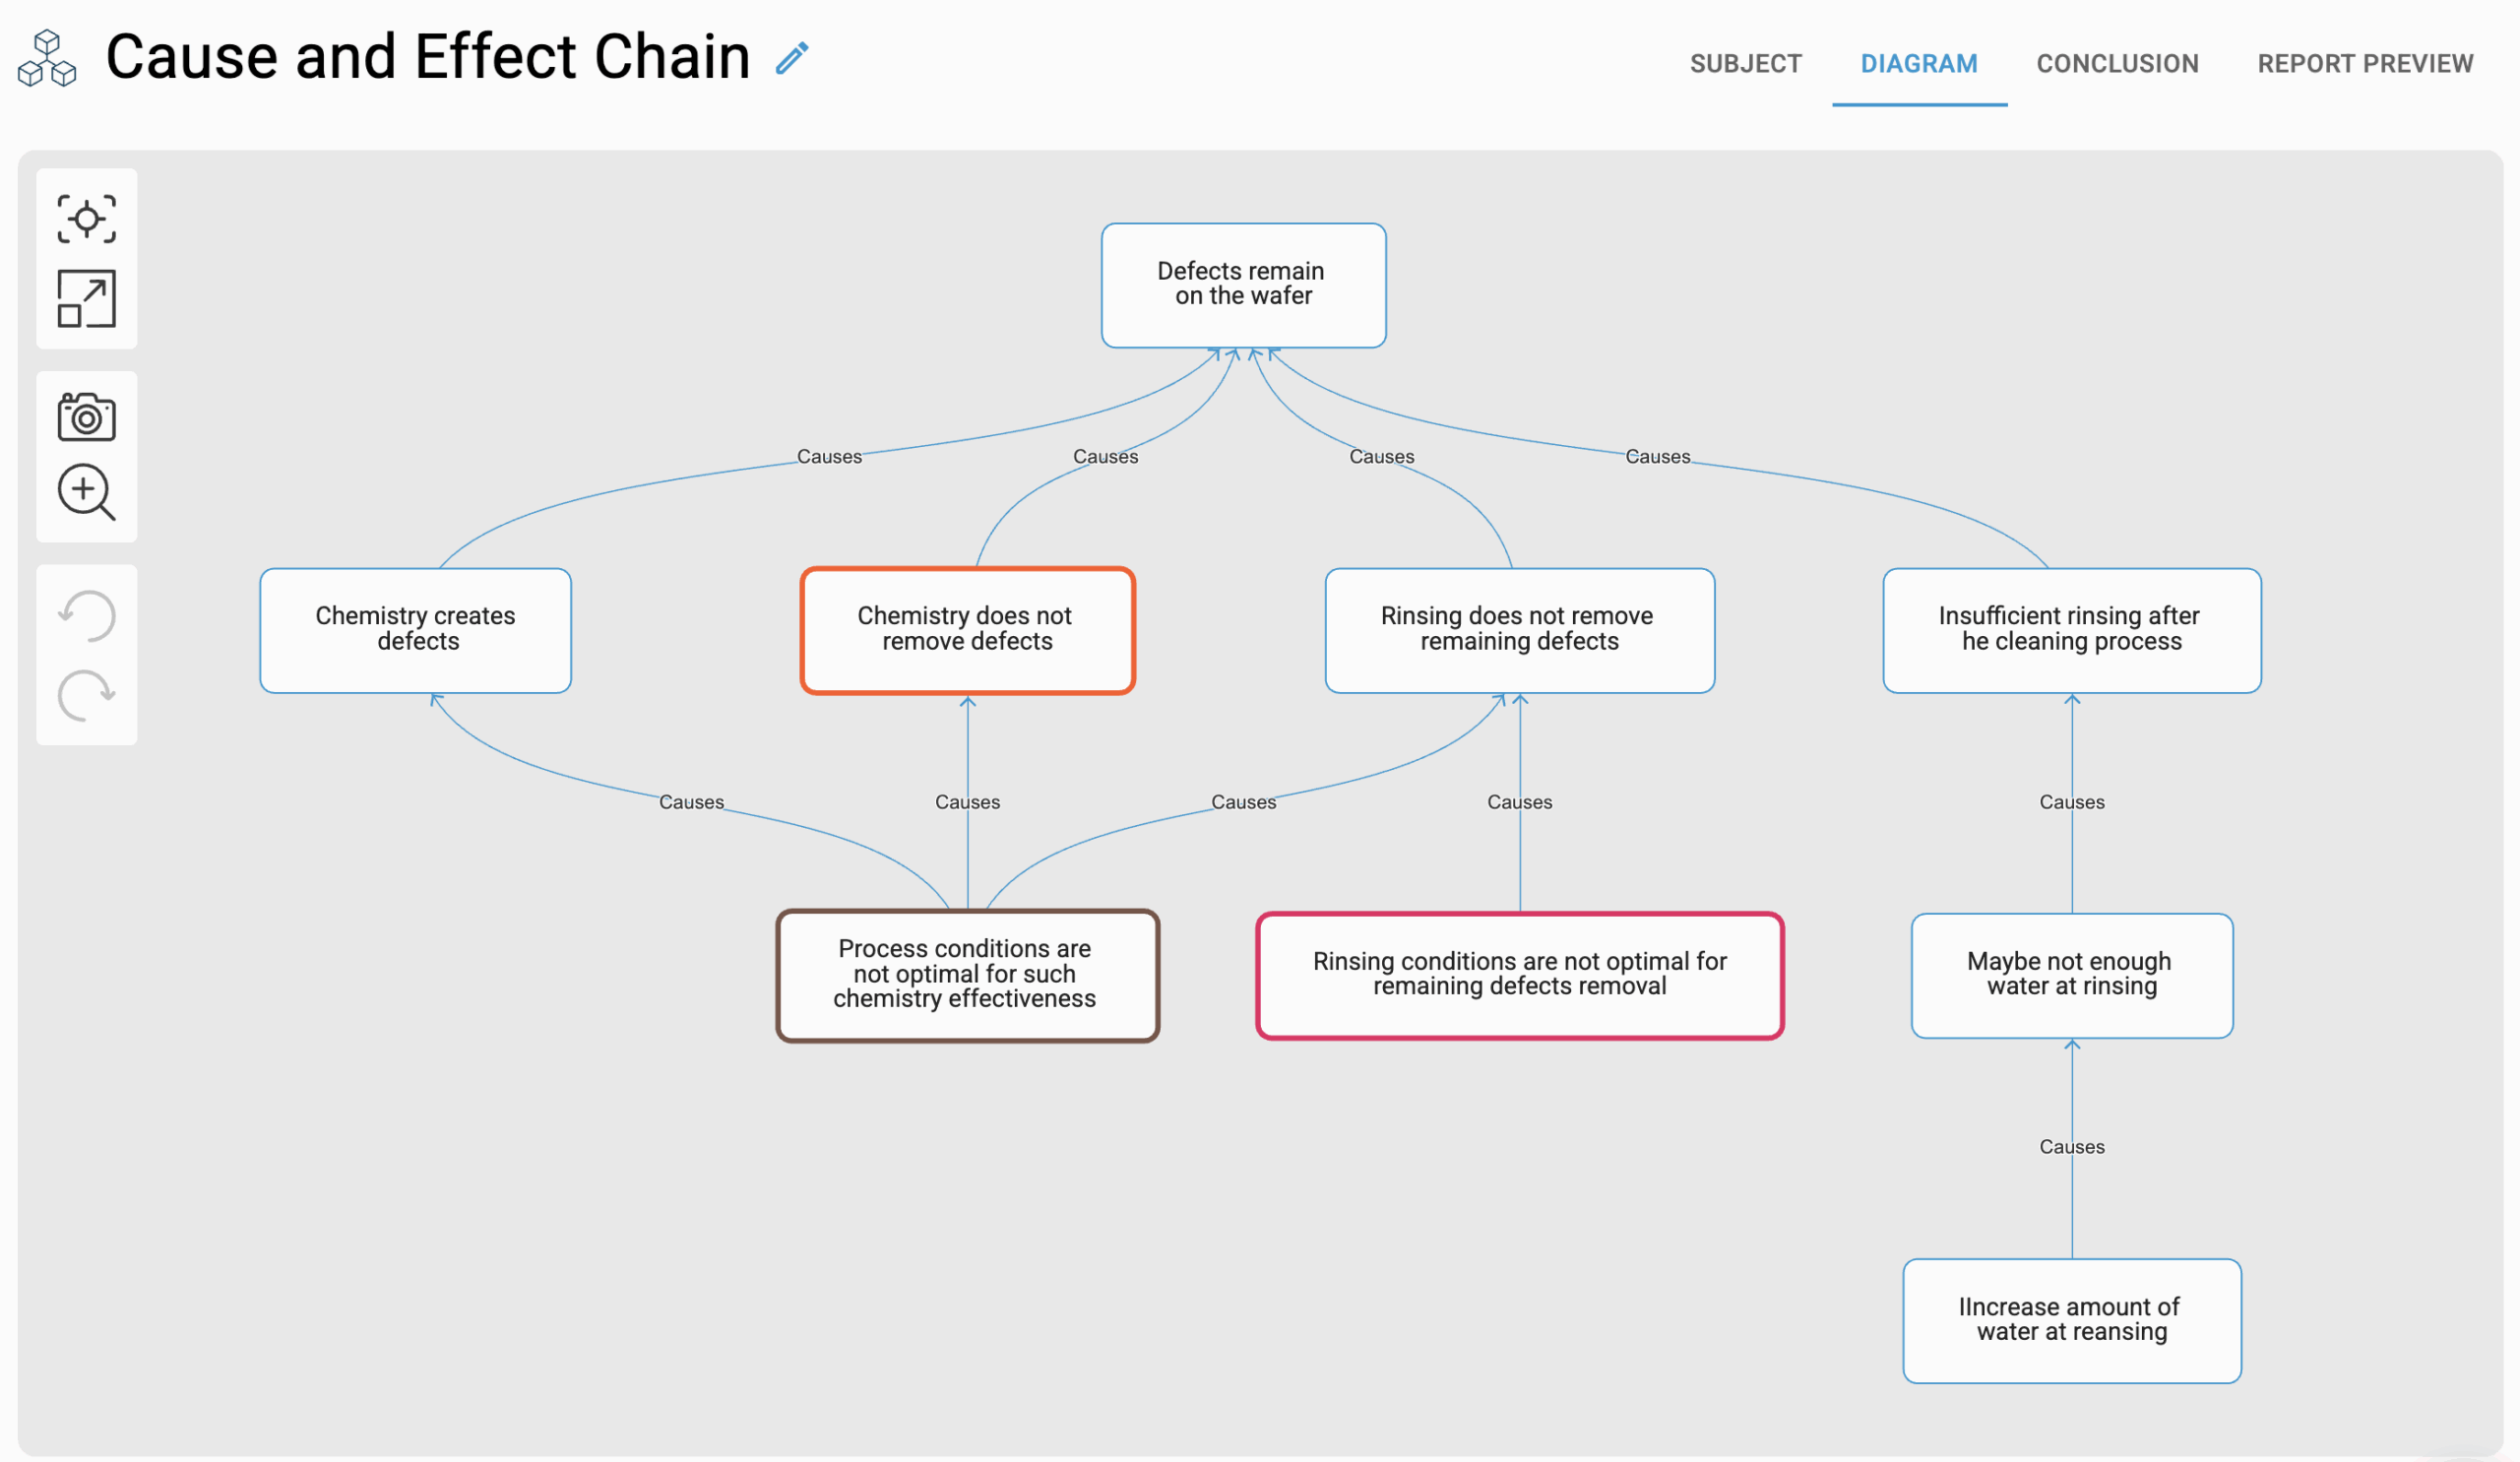
PRIZ integrates CEC with other RCA methods, notably 5+ Whys. Teams can explore a broad cause‑and‑effect tree, then zoom into a specific branch and use 5+ Whys to drill down linearly. The platform also distinguishes between fundamental reasons (FRPs) and auxiliary reasons (ARPs), helping teams prioritize immediate corrective actions while documenting deeper systemic issues. The interactive environment encourages collaboration and knowledge sharing, turning RCA into a continuous learning process rather than a one‑time exercise. In this way, PRIZ’s cause‑and‑effect chain tool can be seen as a next‑generation evolution of the fishbone diagram, retaining its strengths while addressing its shortcomings.