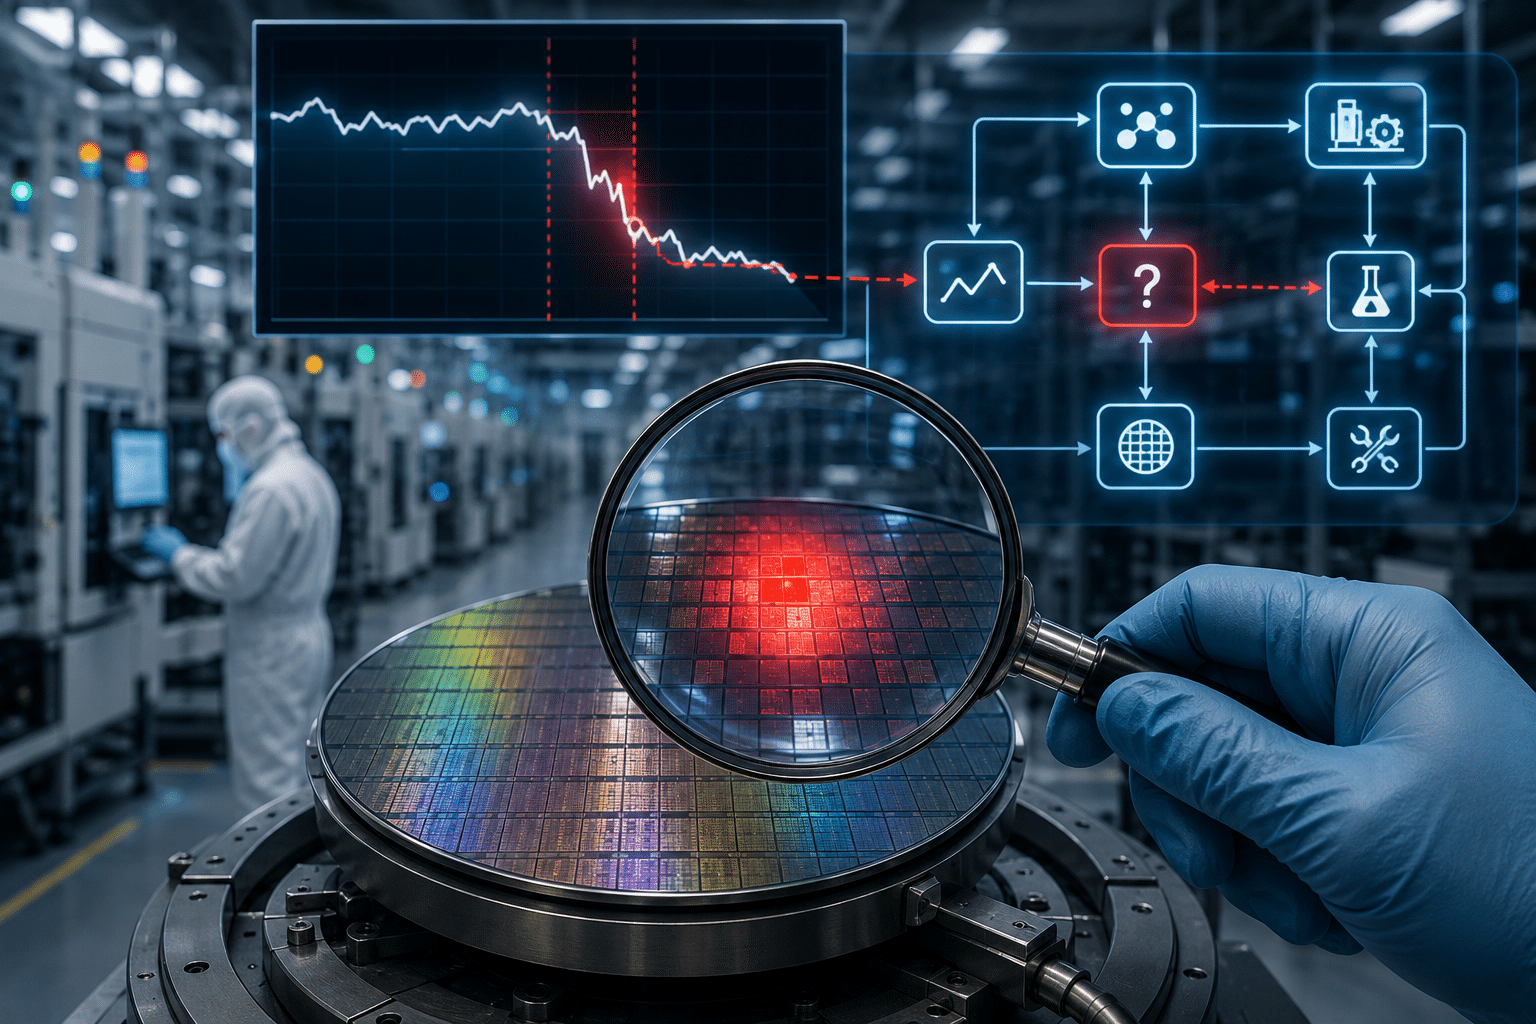
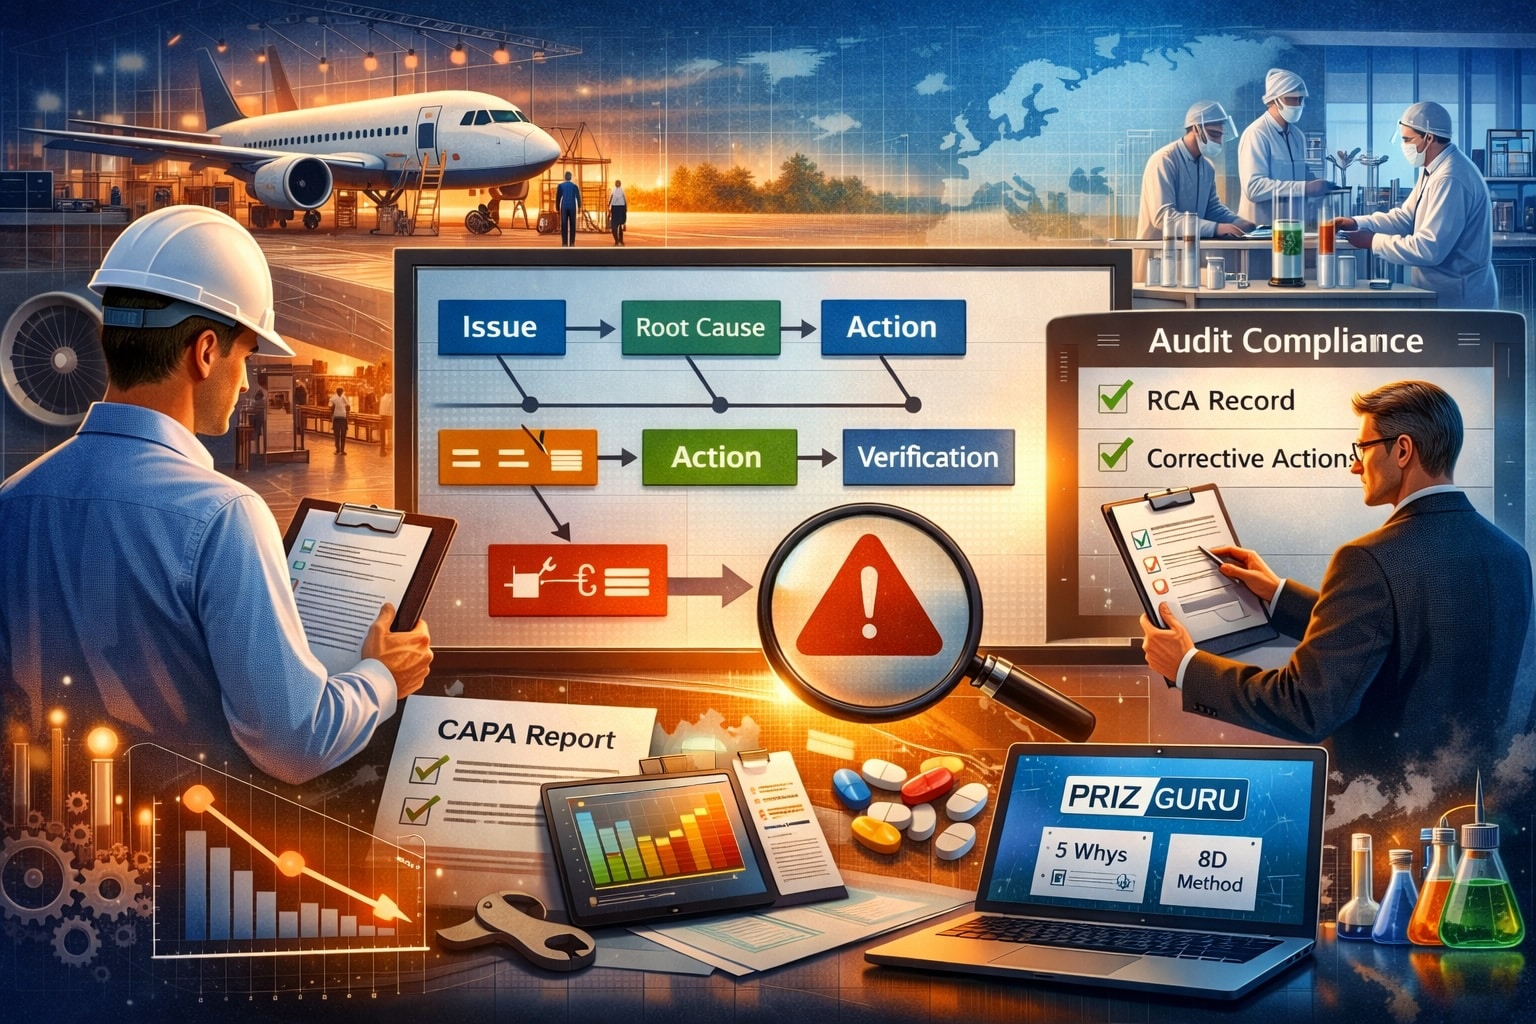
A production line drifts out of spec at 2:10 a.m. Scrap piles up. The dashboard shows a temperature excursion, a vibration spike, and a quality alarm. The team has data, yet the data sits in separate silos: sensor historians, MES, maintenance notes, and shift handovers. Engineers can still solve this the classic way: pull charts, interview operators, sketch a fishbone, run 5 Whys. Yet every hour adds cost and pressure.
AI root cause analysis changes the tempo. Machine learning can scan thousands of signals, detect subtle precursors, group related anomalies across systems, and propose a short list of probable causes to validate. Teams keep ownership of the decision, while algorithms accelerate the search for evidence.
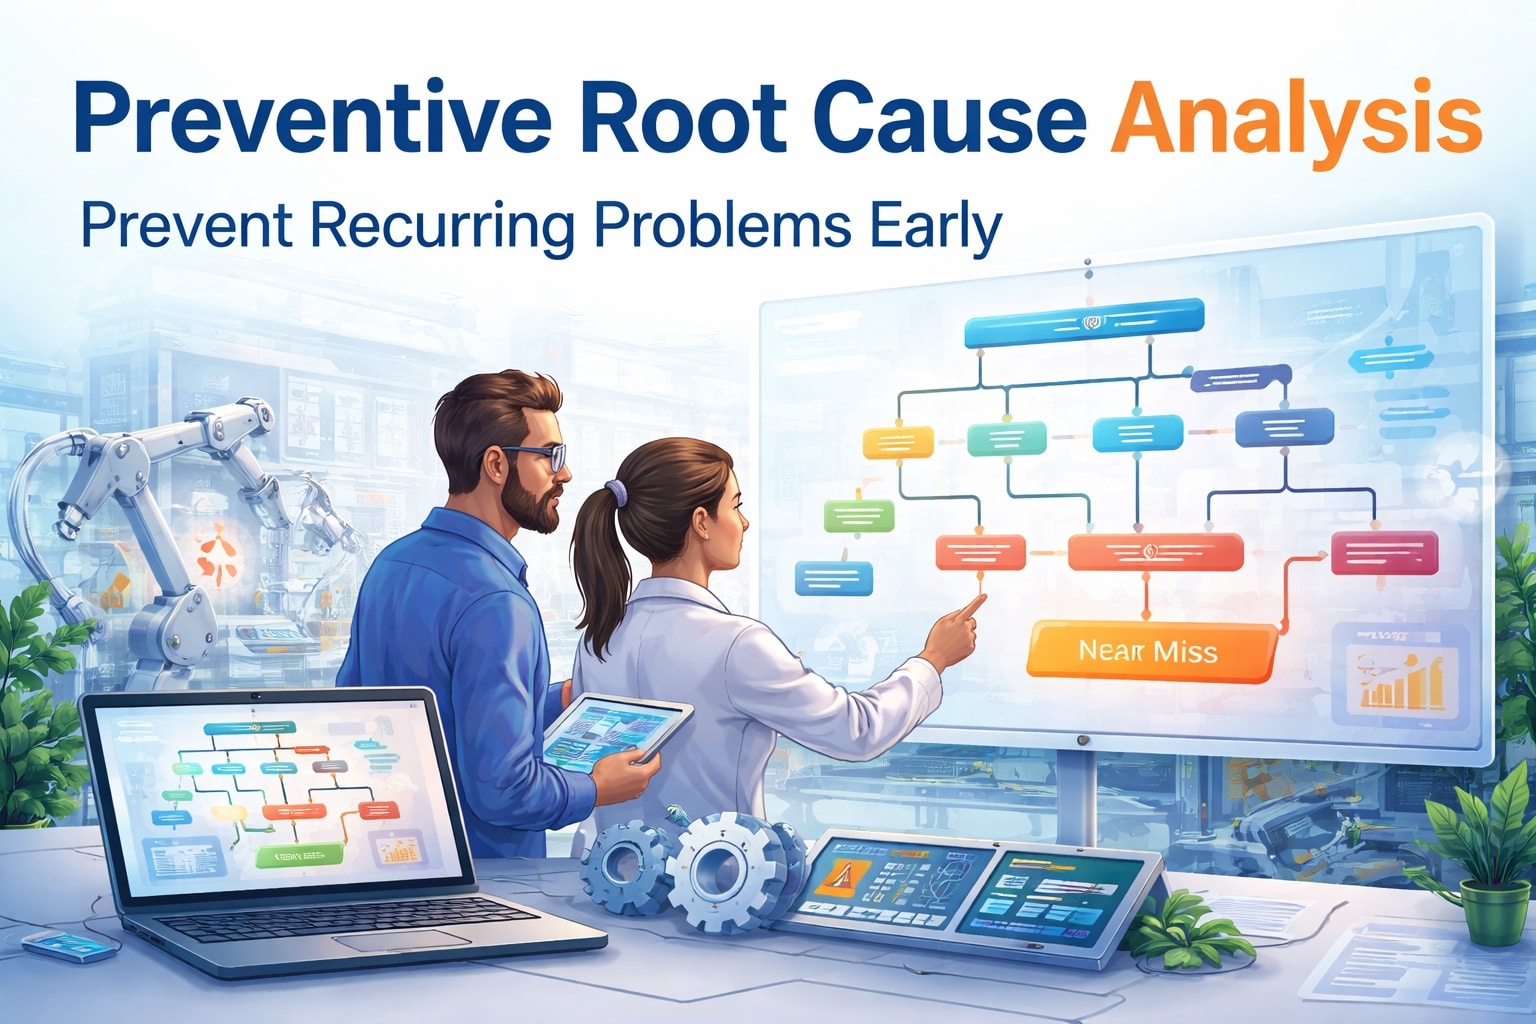
This article explains how automated root cause identification works in practice, which AI techniques matter, and how a structured method (like PRIZ Guru’s Cause & Effect Chain and guided workflow) turns AI suggestions into durable corrective and preventive action.
Root cause analysis aims to uncover causes that drive a failure and eliminate recurrence through process improvement. ASQ defines a root cause as a factor that caused a nonconformance and should be permanently eliminated via process improvement, and it describes RCA as an umbrella term for approaches and tools used to uncover causes.
In modern operations, three forces keep the RCA slow. Signal volume rises fast across sensors, logs, metrics, traces, alarms, and quality records. System coupling spreads a single disturbance through many subsystems, which blurs the trail. Expert attention stays scarce, especially during downtime, customer escalations, and audit windows.
AI supports each pressure point by filtering noise, surfacing relationships, and keeping analysis coherent from symptom to cause to action.
AI in RCA delivers value through three recurring moves: detection, connection, and explanation.
Detection identifies signals that deviate from normal patterns, often earlier than control limits. Connection groups related anomalies across systems and align them on a shared timeline. Explanation ranks candidate causes and shows evidence trails that engineers can validate.
AIOps teams often describe the connection step as “cross-stack anomaly correlation.” IBM gives a concrete illustration: many anomalies across logs, metrics, and traces can be stitched together into a much smaller set that points to a single root cause event.
Correlation helps triage. Causality guides intervention.
Many failures start as weak signals. A model can learn baseline behavior for dozens or thousands of variables, flag deviations, then bundle anomalies by time, topology, and shared context. In manufacturing, this can connect a drift in feeder motor current to a downstream dimensional change minutes later. In software, it can connect a spike in database latency to timeouts across services.
The practical outcome stays simple: engineers get a compact “episode” with a timeline, which reduces the search space for RCA.
Causal discovery techniques learn directional relationships from observational time series and build a graph that represents influence. Once a system has a causal graph, root cause identification can proceed by locating where anomalies originate and propagate.
Research literature offers multiple approaches for root cause identification in time series using causal structures, including methods that leverage summary causal graphs and the timing of anomalies. A 2024 arXiv paper describes a causal-discovery-based root-cause analysis method that estimates causal relationships between prediction error and explanatory variables, then uses Shapley-style attribution on top of the learned causal structure.
In microservice operations, neural Granger causal discovery has been used to rank root causes across services using time ordering and learned dependencies.
For industrial teams, the key takeaway stays consistent: a causal graph converts a web of correlations into a directional story that supports intervention planning.
A large share of troubleshooting evidence lives in text: operator notes, maintenance logs, NCRs, audit findings, supplier emails, and incident reports. NLP can extract entities (machine, lot, recipe, tool ID), normalize terminology, and link text evidence to time series events.
This enables a powerful workflow. The algorithm links “recipe updated to v3.2” from a note to the moment drift began, then pulls sensor patterns around that timestamp for validation.
Large language models can act as copilots for RCA sessions when paired with structured inputs: a precise problem statement, a timeline, an evidence list, and a formal cause model. They can draft hypotheses, propose missing evidence to collect, and generate a first-pass corrective action narrative.
Value comes from guardrails. The model works inside a method, cites evidence, and treats its output as a hypothesis set. Humans validate, test, and approve.
Consider a high-mix electronics line with intermittent solder voids. The defect rate rises twice per week, then falls back, which makes the issue feel random.
An anomaly model flags a repeatable pattern: voids rise within 40 minutes after a paste viscosity reading crosses a threshold and ambient humidity increases, plus a subtle increase in stencil pressure variance. The system then bundles these signals into a single episode and aligns them on a timeline.
A causal graph learned from past runs suggests a path:
ambient humidity → paste viscosity shift → print deposit variation → void rate
The model ranks two candidate first movers: humidity and paste age.
Engineers validate through a controlled sample: run a short trial with humidity held constant and compare the deposit thickness distribution. The trial confirms deposit variation tracks humidity excursions. The corrective action adds a humidity control loop and updates paste handling. Preventive action adds monitoring for leading indicators and a standard response playbook.
The pattern repeats across domains. AI accelerates discovery, engineering practice delivers proof, and structured documentation preserves learning.
A repeatable AI-powered root cause analysis process follows a clear sequence.
Begin with a precise problem definition. Capture what failed, where it happened, and how success will be measured. ASQ emphasizes that RCA sits inside a broader problem-solving effort and relies on teams that can implement solutions.
Build a time-aligned evidence record by merging sensor data, alarms, process parameters, and text records into a single timeline. Use anomaly correlation to narrow the episode, then use causal discovery, dependency graphs, or supervised models to rank likely causes.
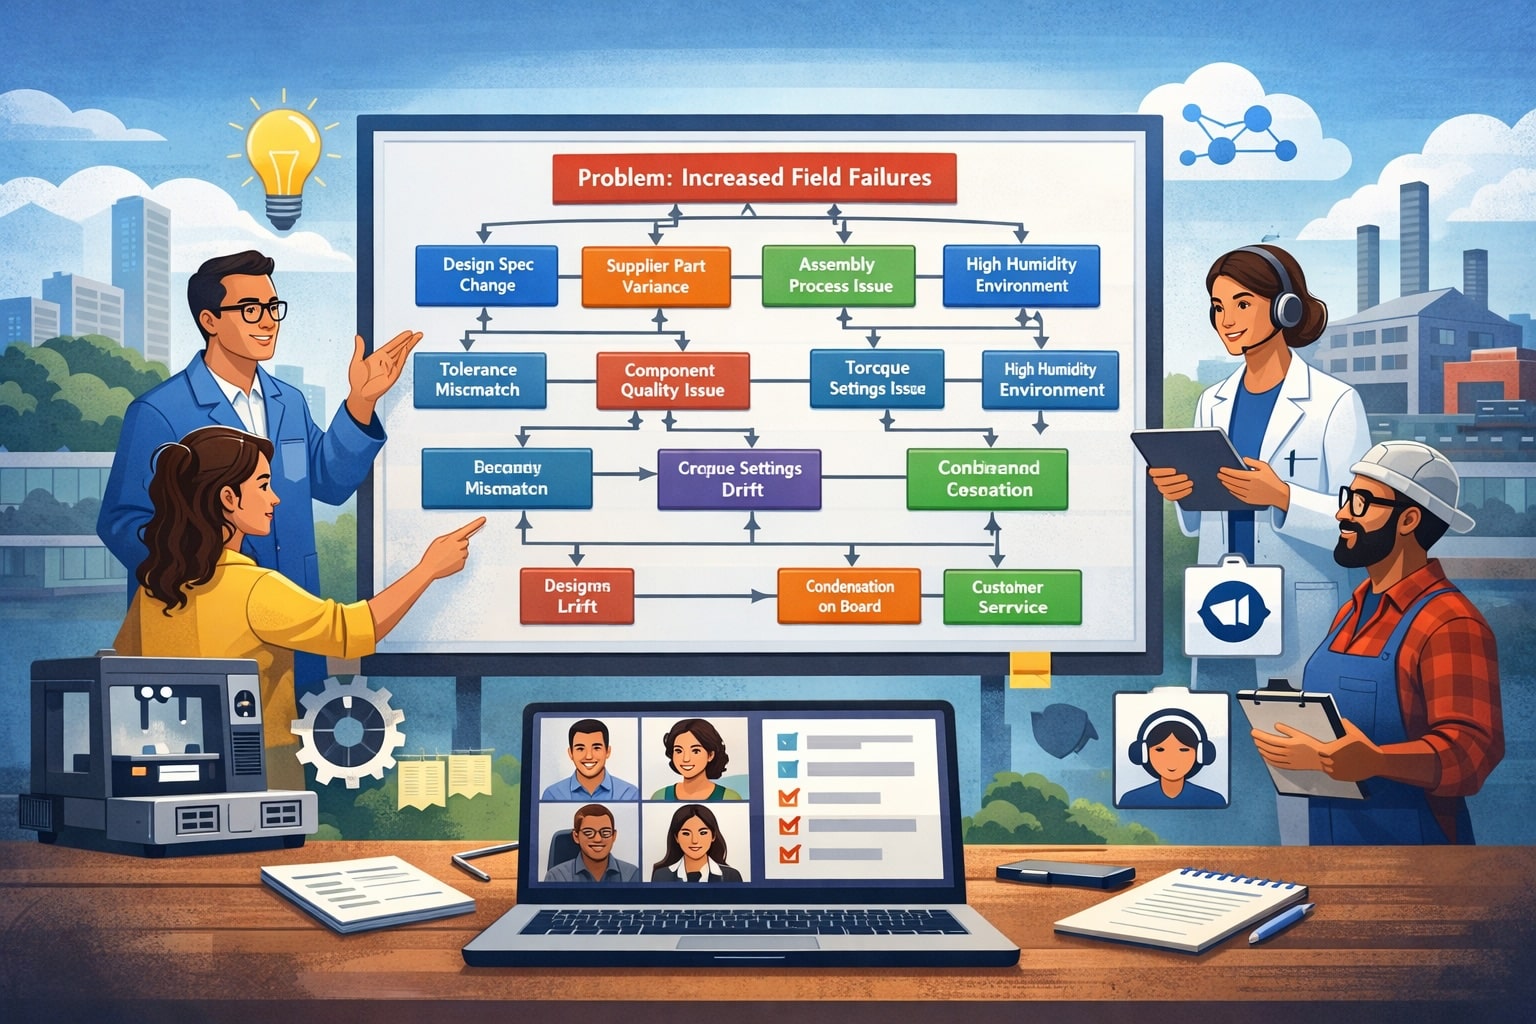
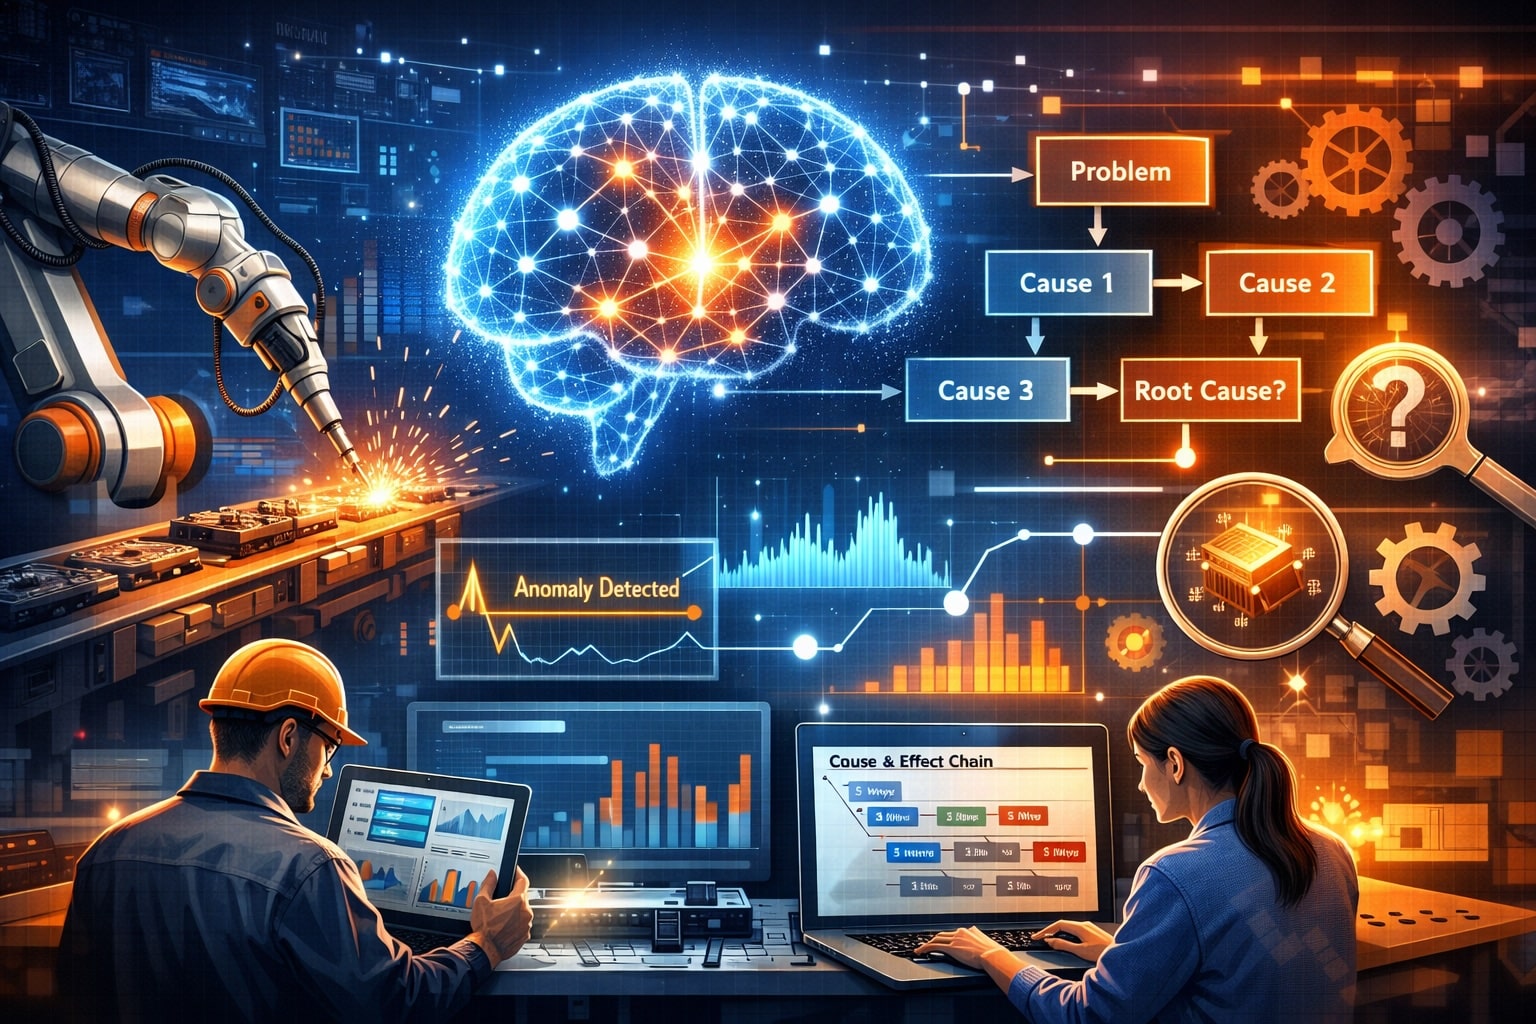
Translate candidates into a cause model. Map the episode as a Cause & Effect Chain: each node represents a condition that leads to the next, until the failure occurs. Design discriminating tests for high-ranked causes, then select actions that remove the cause and verify improvement through monitoring and leading indicators.
AI produces suggestions. A method produces decisions.
PRIZ Guru serves as root cause analysis software built around structured thinking tools for RCA—Cause & Effect Chain, 5 Whys, and Functional Modeling, plus guided facilitation and collaboration.
That structure makes AI outputs usable in real work. Evidence stays attached to specific causes. Branching remains visible in complex problems with multiple contributing paths. Actions remain connected to the analysis for CAPA-style follow-through and audit-ready reporting.
PRIZ Guru’s AI-assisted vision for RCA centers on automated evidence intake, candidate cause proposals expressed as draft nodes in a Cause & Effect Chain, and fast report generation aligned with the model and evidence.
Quality assurance teams operate in regulated environments where traceability matters. AI supports QA by improving completeness and speed of investigation, while structured documentation supports audits and CAPA programs. ASQ training materials highlight RCA tools such as FMEA and 5 Whys, and they reference models such as 8D, PDCA, and DMAIC.
A strong governance model includes data lineage, model monitoring, and clear approval steps for corrective actions. The combination of AI support and a structured RCA method provides the backbone for that governance.
AI adds power, and power demands discipline.
Spurious correlation appears when signals move together due to seasonality or shared upstream drivers. Causal discovery plus domain review reduces this risk.
Missing context appears when a model lacks maintenance events, recipe changes, or supplier-lot tracking, which shifts rankings away from the true cause.
Automation bias appears when teams accept a ranked list too quickly. A Cause & Effect Chain plus discriminating tests keeps decisions evidence-driven.
AI-powered RCA benefits from consistent instrumentation and data hygiene. Aim for synchronized timestamps across systems, stable identifiers for equipment and lots, clear change logs for recipes and maintenance, and a simple taxonomy for incidents. Add a lightweight routine for capturing “what changed” during every deviation. These habits raise signal quality for both humans and models.
AI-powered root cause analysis shifts troubleshooting from manual pattern hunting to evidence-guided decision making. Correlation and anomaly detection reduce noise. Causal discovery and structured models convert signals into an actionable story. Teams gain speed, traceability, and a stronger continuous-improvement loop.