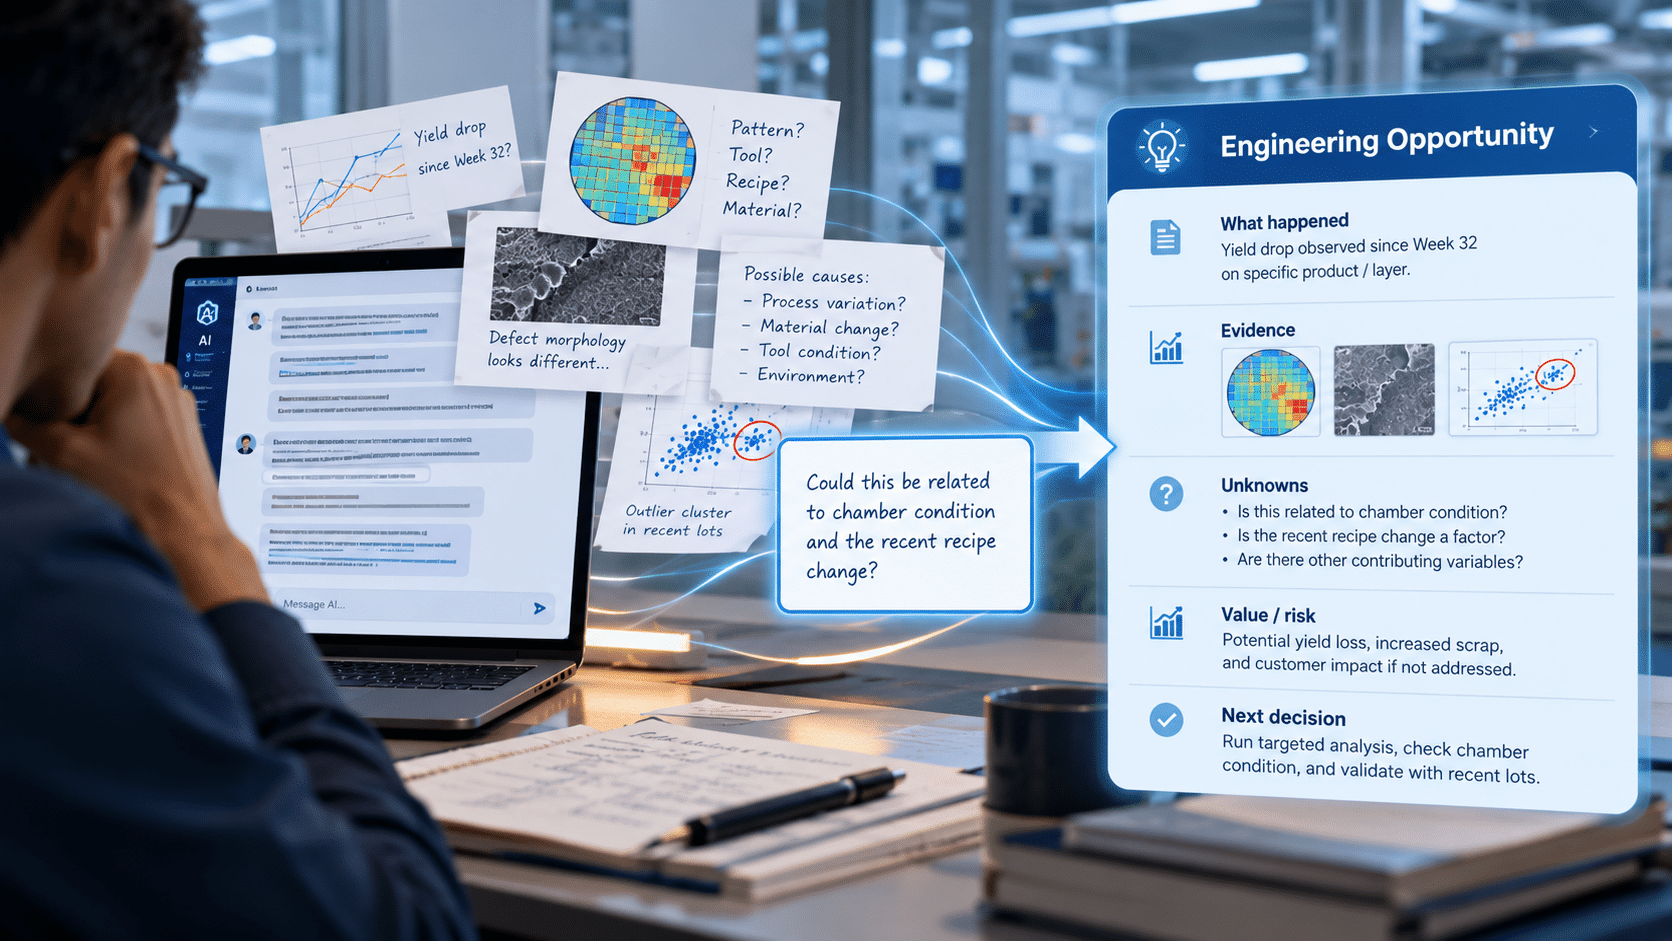
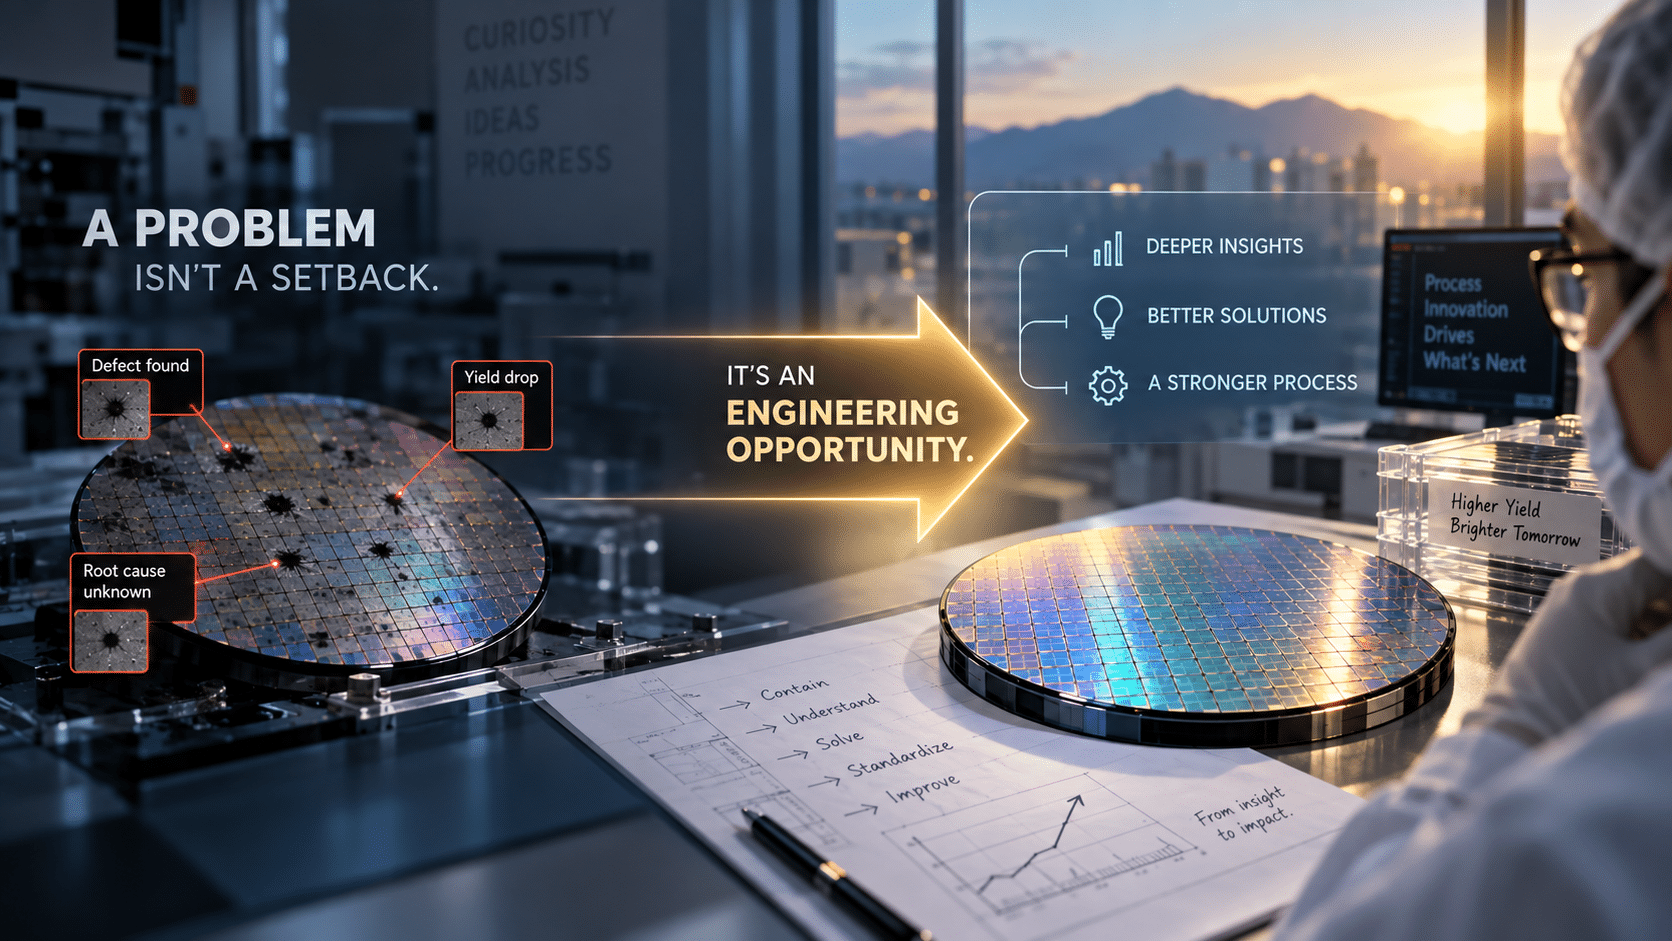
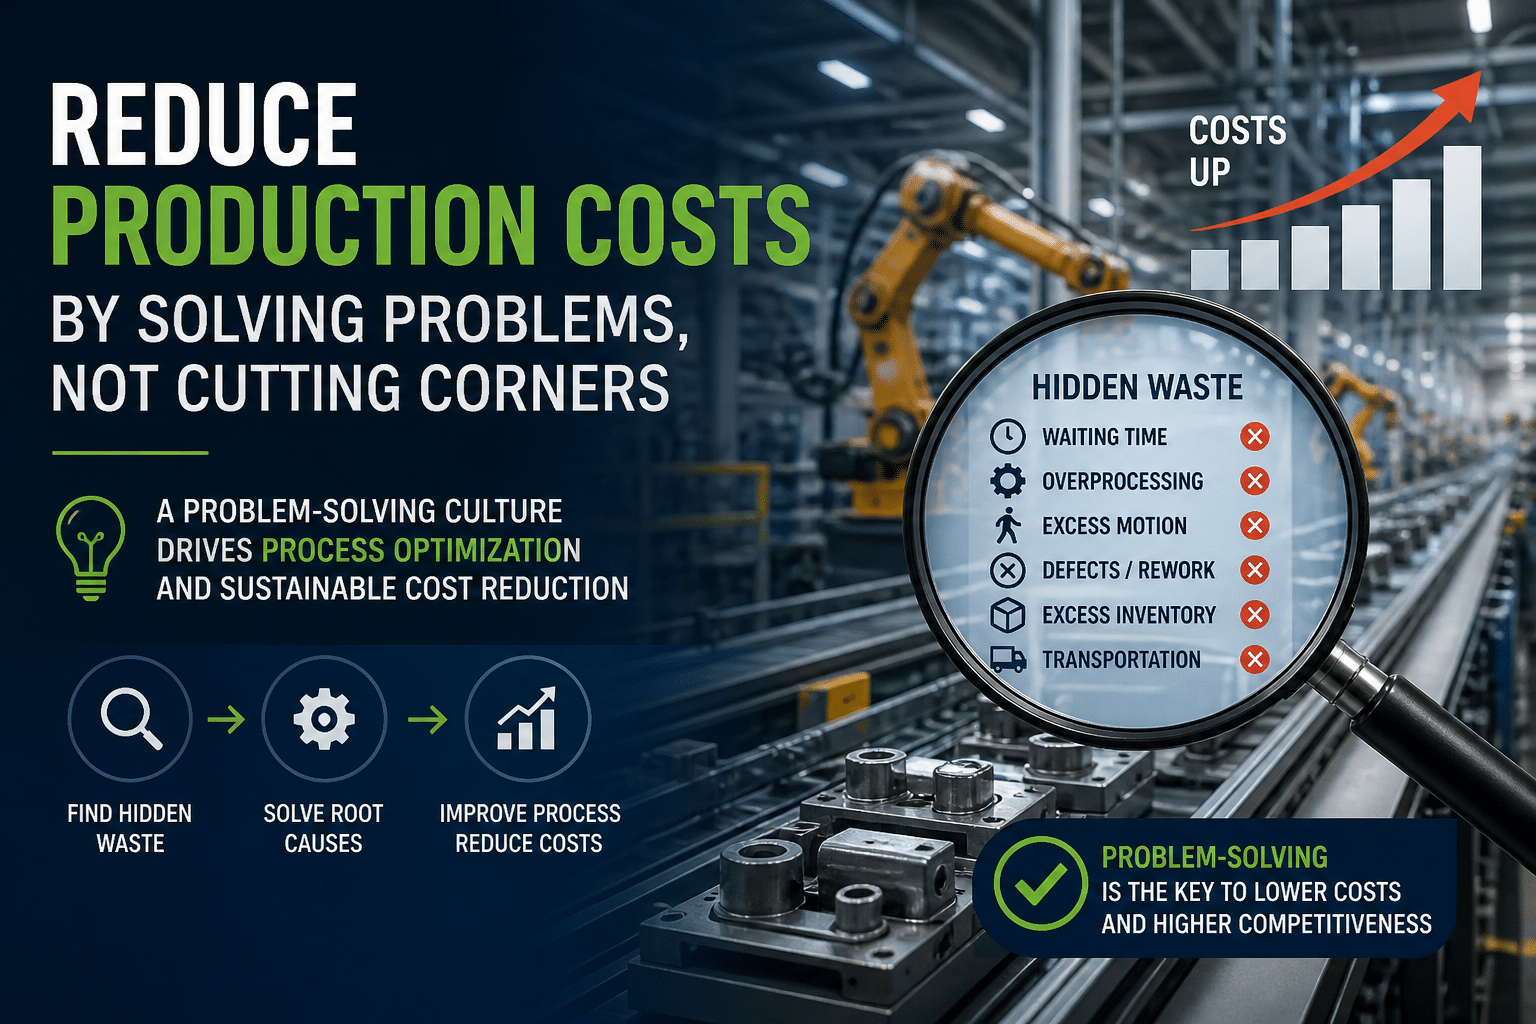
Every recurring defect is your system sending the same message again and again. Root cause analysis (RCA) is how you finally decode that message and change the system, not just the outcome. When a conveyor belt keeps jamming or a software build repeatedly fails, teams can either patch the symptom or take the time to understand why the problem keeps recurring. RCA provides the framework for the latter. Rather than mopping the floor every time it’s wet, you fix the leaking pipe. By finding and addressing the initiating event in a cause‑and‑effect chain, you prevent the problem from reappearing.
This article explores modern RCA techniques such as 5 Whys, Cause‑and‑Effect Chains, fishbone diagrams, FMEA, and fault‑tree analysis, and explains when to use each. We also highlight how PRIZ Guru’s tools and AI support help practitioners dig deeper, collaborate across teams, and convert analysis into innovation.
Root causes are events in a cause‑and‑effect chain. According to the Financial Risk Group’s guide on data governance, a root cause is the initiating event or condition in a cause‑and‑effect chain, and it must be subject to change; that is, it can be adjusted to create a positive outcome or prevent a negative one. A proper root cause should meet four criteria: it initiates the chain of subsequent events, it is practical to identify, it can be affected by management actions, and it forms a basis for corrective measures. Focusing on causes that meet these criteria prevents teams from chasing symptoms.
Structured problem solving avoids the “fix and forget” trap. RCA shifts the mindset from repairing broken parts to improving the system. The CheckProof guide notes that RCA is built on three principles: base decisions on facts, involve the people closest to the work, and look across the full timeline instead of stopping at the moment something broke. These principles make RCA a team sport and encourage a comprehensive view of the system, especially important when problems stem from interactions across departments.
Modern RCA isn’t a single method; it’s an umbrella of tools tailored to different types of problems. The simplest techniques help you peel back obvious causes, while more advanced methods model complex systems. The summary table below contrasts the most common RCA tools.
| Technique | Core Idea | Best Used For | Strengths/Limitations |
|---|---|---|---|
| 5 Whys | Ask “why?” iteratively to trace a linear chain of cause–effect relationships. | Simple problems with a single dominant cause; training teams in structured thinking. | Easy to learn and quick to apply. Can stop too early or miss parallel causes if analysts aren’t disciplined. |
| Cause‑and‑Effect Chain | Build a branching chain of “why?” questions, exploring multiple paths and auxiliary reasons. | Multifaceted problems where several contributing factors interact. | Encourages breadth as well as depth. Requires facilitation to prevent endless branching and to ensure evidence backs each link. |
| Fishbone (Ishikawa) Diagram | Visualize possible causes grouped by category (e.g., materials, methods, people); the head of the fish is the problem, and bones represent categories and sub‑causes. | Complex problems with multiple potential drivers, especially in manufacturing and quality. | Helps teams brainstorm systematically and see patterns. Can become cluttered; may not indicate which causes are most significant without data. |
| Fault‑Tree Analysis (FTA) | A deductive, top‑down method that uses logic gates to model how combinations of faults lead to a top event. | Safety‑critical systems (aerospace, nuclear, chemical) where failure modes interact; quantifying reliability. | Maps complex interactions and calculates failure probabilities. Requires expertise and detailed component data. |
| Failure Modes & Effects Analysis (FMEA) | Proactively identify potential failure modes, their effects, and severity; rank risks using Risk Priority Numbers. | Designing new products or processes and improving reliability before failures occur. | Encourages proactive thinking and prioritization. Can be time‑consuming; subjective ratings may bias results. |
The 5 Whys technique, popularized by Taiichi Ohno at Toyota, asks “why?” repeatedly until the root of the problem emerges. The method emphasises exploring cause‑and‑effect relationships by directing each “why” to the answer of the previous “why”. The number five is simply a rule of thumb; complex problems may require three or seven iterations. For example, when bolts cross‑thread on an engine line, successive “why” questions might reveal that an unstable shelf caused cutting tools to fall and not be replaced.
When to use: The 5 Whys shines when problems are straightforward, data is limited, and the team needs a quick diagnosis. It encourages people to go beyond symptoms and challenge assumptions. However, it can oversimplify complex issues; critics note that the depth is arbitrary. Teams sometimes stop at a convenient cause or blame individuals rather than systems.
In the PRIZ Innovation Platform, 5+ Whys is treated as a creative thinking tool, not a rigid rule of “exactly five questions.” The chain of causes can be as long or as short as it needs to be; the goal is a complete and logical cause–effect sequence, not hitting a magic number.
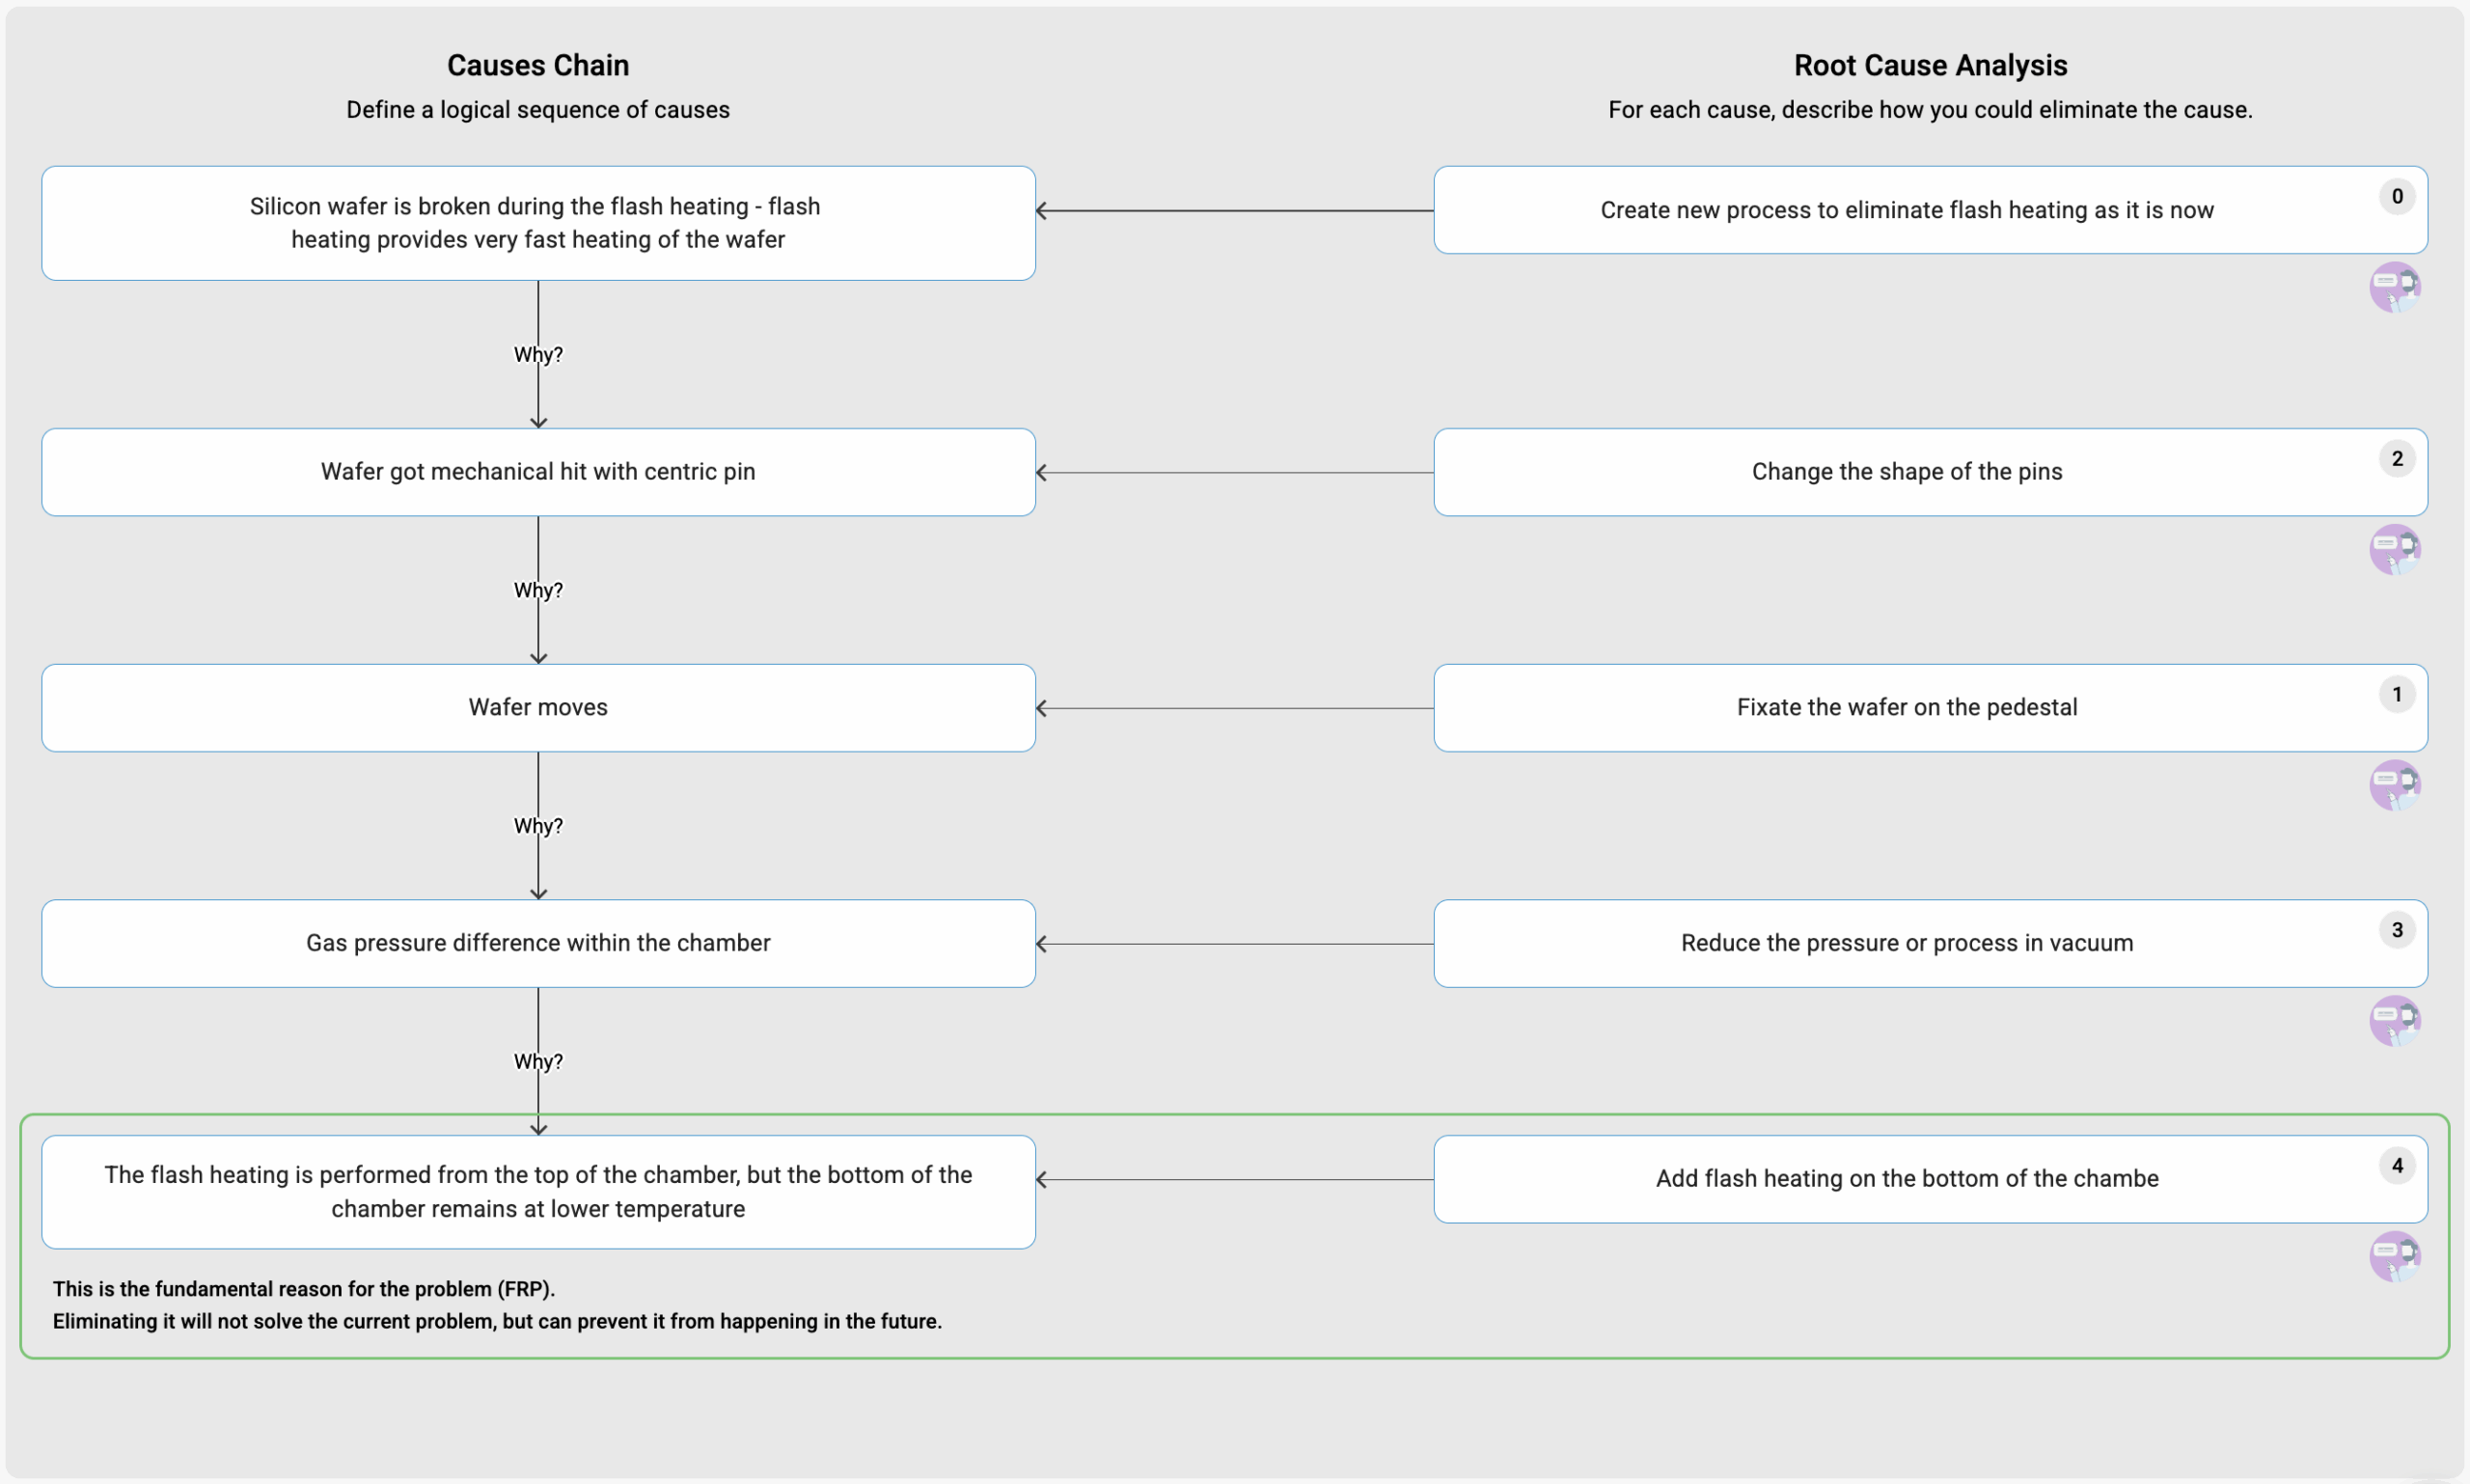
To make that logic usable in real projects, PRIZ distinguishes between two types of reasons in the chain: Auxiliary Reasons of the Problem (ARPs) and the Fundamental Reason of the Problem (FRP). ARPs are any causes along the chain that, if removed, will solve the current problem, but there is a chance the issue may return later. The FRP is the last, deepest cause in the chain: it usually does not change today’s situation immediately, but it shapes how you prevent similar problems in the future.
This changes how teams think about “root cause”. In PRIZ, every step in the 5+ Whys chain is treated as a source of potential solutions, not just a stepping stone on the way to a single ultimate cause. ARPs often drive practical corrective actions (what you fix now), while the FRP inspires long-term design or system changes (how you stop this family of problems from ever appearing again).
The 5+ Whys tool in PRIZ supports this philosophy technically as well: it lets users build and extend the chain on a visual board, store answers, and connect each reason to ideas or corrective actions. Machine assistance and AI guidance help teams push beyond their first intuitive answers, break psychological inertia, and explore deeper, sometimes non-obvious reasons and solution directions.
A linear chain of whys doesn’t always capture the tangled web of causes behind real‑world problems. Cause‑and‑Effect Chain Analysis expands on the 5 Whys by allowing branching. Instead of insisting on a single reason, the analyst asks “why?” at every significant cause, creating multiple “cause” branches that eventually converge at an underlying failure or system flaw. This structure acknowledges that systems might not always fail for a single reason; an auxiliary cause can be as important as the main cause.
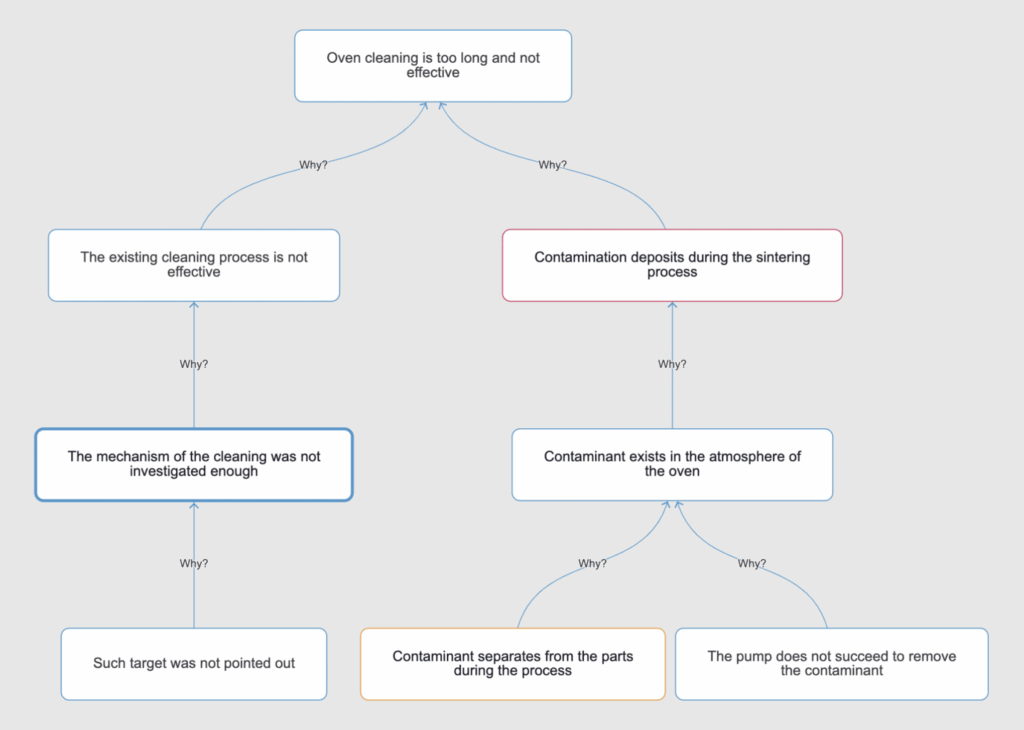
When to use: Use cause‑and‑effect chains when problems have intertwined technical and organisational factors; e.g., a production defect caused by poor material, operator fatigue, and outdated procedures. Branches allow each factor to be explored separately while keeping them connected to the original problem. The process is more time‑intensive than 5 Whys but yields a comprehensive map of contributing factors.
In PRIZ, the Cause-and-Effect Chain (CEC) isn’t just a prettier fishbone; it’s rather treated as a reasoning system for understanding how events, actions, and conditions influence one another over time. The CEC tool helps teams build a tree-like diagram where a single root node (the symptom, failure, or goal) branches into primary, secondary, and so on, causes or consequences, making it easier to see dependencies, side-effects, and “hidden” links in the system.
The tool is structured around three key spaces: Subject, Diagram, and Conclusion. The Subject tab holds rich-text context about the system, process, or failure (including images and whatever else is required), so the team never loses sight of the bigger picture while they’re modeling. The Diagram tab is where the CEC tree lives – starting from a root node that represents the effect you’re analysing, and branches are added as the team explores “what led to this?” and “what else does this influence?” or “what may cause this?”. The Conclusion tab captures the insights, decisions, and next steps that emerge from the analysis, turning a thinking exercise into a concrete outcome.
Philosophically, PRIZ positions the Cause-and-Effect Chain as more than a way to “hunt one root cause.” It’s a creative thinking tool for understanding the system:
Within that chain, PRIZ distinguishes between Auxiliary Root Problems (ARPs) and the Functional Root Problem (FRP). ARPs are actionable causes along the branches where you can intervene to fix the current situation; the FRP sits deeper and describes a more fundamental functional issue in the system or design. This means every node in the CEC can become a lever for ideas and corrective actions, while the FRP guides long-term, structural improvements rather than one-off fixes.
On the platform, the CEC diagram is an interactive canvas: teams add nodes, branch them with multiple “whys”, attach evidence (logs, sensor data, photos, documents), and refine the structure as their understanding evolves. All of this happens in a shared workspace, so remote teams can co-edit the chain in real time and seamlessly connect it to ideas, tasks, and reports.
The fishbone diagram, also known as the Ishikawa diagram, visualizes possible causes of a specific event. The diagram resembles a fish skeleton: the defect or problem is the head of the fish, and causes branch off as ribs and sub‑ribs. Causes are typically grouped by category. Manufacturing commonly uses the “6 M” categories (man, machine, method, material, measurement, and mother nature). Each rib may have several branches representing deeper causes.
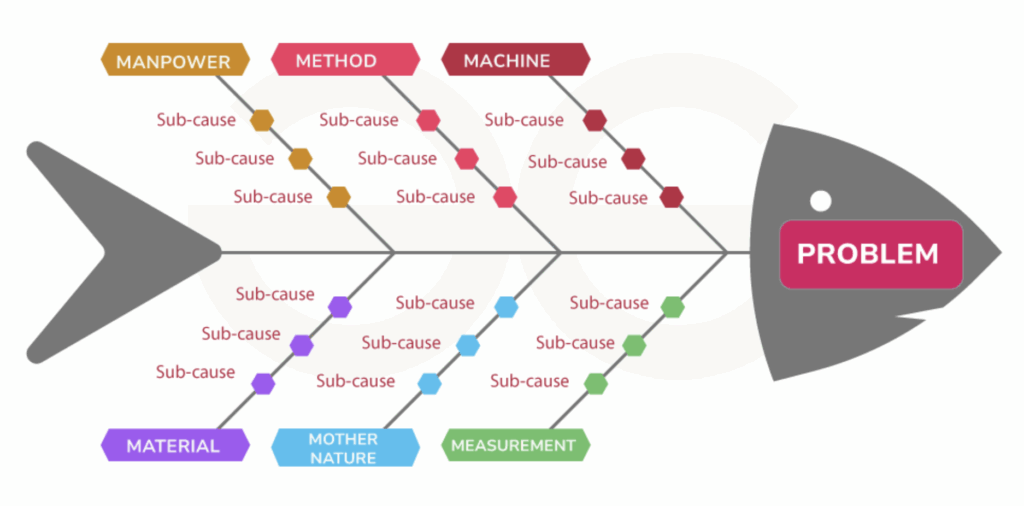
When to use: Fishbone diagrams shine in brainstorming sessions where the problem is complex or crosses functional boundaries. By visualising categories, the team ensures they consider equipment, environment, processes, and people rather than narrowing prematurely.
Limitations and enhancements: Fishbone diagrams can become unwieldy if too many causes are listed without prioritisation. Combining fishbone brainstorming with data, such as Pareto analysis or FMEA, helps highlight the most significant contributors. PRIZ Guru’s Cause‑and‑Effect Chain tool can import fishbone outputs, preserving categories while allowing deeper branching and linking them to evidence.
Fault‑Tree Analysis (FTA) is a deductive technique that examines an undesired state (top event) and models how combinations of lower‑level events lead to it. FTA uses logic gates (AND, OR) to represent how component failures combine. This method originated in the aerospace industry and is widely used in high‑hazard sectors such as nuclear power, chemical processing, and pharmaceuticals. It can also aid software debugging, serving as a diagnostic tool to identify and correct causes of a top event.
When to use: FTA is ideal when the analyst needs to quantify failure probabilities or demonstrate compliance with safety requirements. For example, designing a spacecraft’s life‑support system requires understanding which component failures could lead to loss of breathable air and how redundancies mitigate risk. Because it is data‑intensive and often uses Boolean algebra, FTA requires more expertise than basic RCA tools.
PRIZ Guru integration: PRIZ does not currently include a full FTA module, however users can link causes in a logical tree within the Cause‑and‑Effect Chain tool. The PRIZ has the plans to add a fault‑tree add‑on that automatically assigns probabilities based on historical data and calculates risk scores.
FMEA is a structured, step‑by‑step process originally developed in the 1950s for aerospace. It identifies potential failure modes in a product, process, or design, evaluates their effects, and prioritizes them based on severity, occurrence, and detection. The product of these ratings, the Risk Priority Number, helps teams focus on the most critical failure modes.
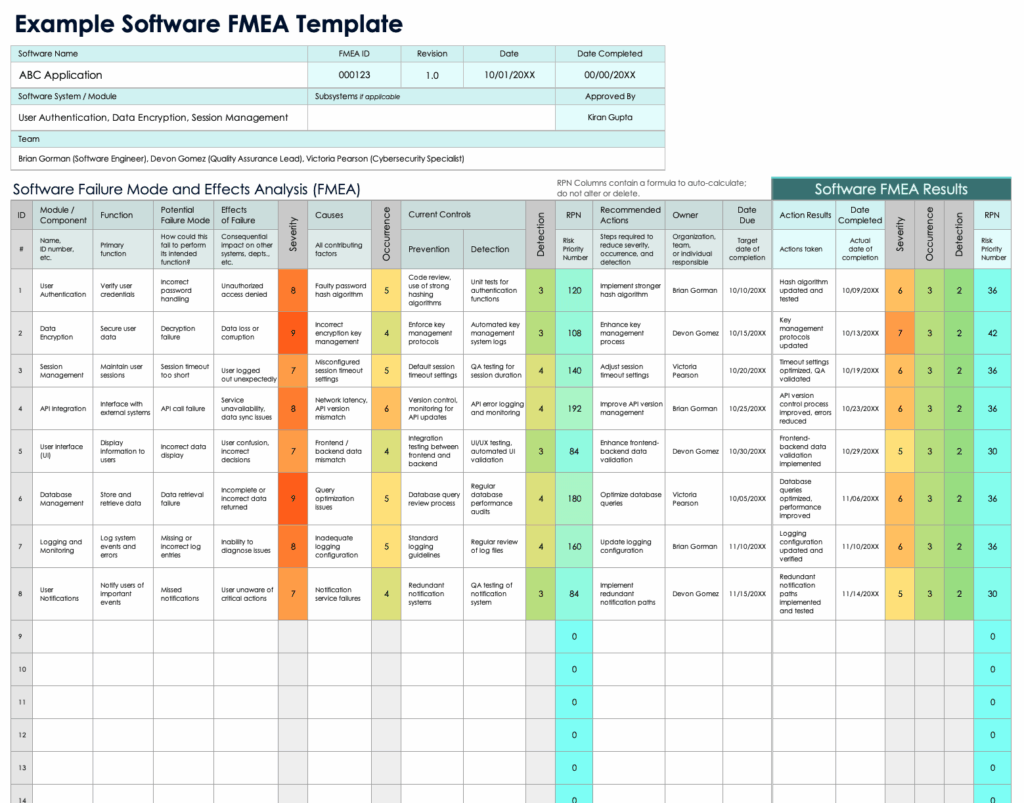
When to use: FMEA is best applied during design or early production stages, when changes are easier and cheaper to implement. Industries such as automotive, healthcare, and nuclear energy use FMEA to anticipate potential failures before a system is deployed. The technique also works for ongoing processes by periodically reviewing risk priority numbers and adjusting controls.
Challenges & Limitations
Classic FMEA is useful, but it has real limits. The neat grid of functions, failure modes, causes, and RPN scores hides a lot of subjectivity: Severity, Occurrence, and Detection ratings are often based on opinion, and multiplying them into an RPN can be mathematically misleading. The table format also flattens reality: complex interactions, cascading failures, and changing operating conditions rarely fit into “one row, one cause“. As a result, FMEA can drift into checklist territory: impressive spreadsheets, shallow understanding, and documents that quickly go out of date.
That’s why FMEA should be treated as one lens, not the root cause analysis method. It’s good for systematically listing and prioritizing potential failure modes; it’s much weaker at explaining how problems actually unfold in time and where to intervene in the system. Complementing FMEA with deeper tools like PRIZ’s 5+ Whys and Cause-and-Effect Chain adds the missing causal storyline, distinguishes between quick fixes and fundamental issues, and turns a static risk table into concrete, system-level change.
PRIZ is a problem‑solving ecosystem designed for innovators, engineers, and quality professionals. Here’s how the platform integrates modern RCA techniques:
Techniques and tools matter, but culture determines whether RCA sticks. Effective organisations embrace the following behaviours:
When leaders foster an environment where problems are seen as learning opportunities and provide teams with practical tools, RCA becomes part of the organisational DNA. Over time, the investment in thorough RCA pays back through fewer recurring issues, higher product quality, and more innovative solutions.
Mastering root cause analysis requires both structured methodologies and supportive tools. Techniques such as 5 Whys, cause‑and‑effect chain, fishbone diagram, fault‑tree analysis, and FMEA each serve a purpose, from quick diagnosis to detailed system modeling. Choosing the right tool depends on the problem’s complexity, the need for quantification, and the stage of the product or process lifecycle. PRIZ Guru’s platform integrates these methods with interactive diagrams and collaboration features, making RCA more accessible and effective. By combining modern techniques with a culture that values learning and prevention, organisations can not only solve problems faster but also innovate for the future.
https://en.wikipedia.org/wiki/Five_whyshttps://www.lean.org/lexicon-terms/5-whys/https://asq.org/quality-resources/fishbonehttps://www.cms.gov/medicare/provider-enrollment-and-certification/qapi/downloads/fishbonerevised.pdfhttps://reliability.com/resources/articles/fmea-guide/https://en.wikipedia.org/wiki/Failure_mode_and_effects_analysishttps://en.wikipedia.org/wiki/Fault_tree_analysishttps://en.wikipedia.org/wiki/Pareto_principlehttps://www.tableau.com/learn/articles/root-cause-analysishttps://www.checkproof.com/root-cause-analysis-101-guide/